
Usage
Monitor usage analytics to see what your users are doing in Visier and gain insights into key user adoption measures.
Access requirements
Data required: Permission with access to Usage subjects, such as Content, Session, User, Visualization Base Content, and Visualization Impression
Content package: Includes Usage content, such as USAGE - All Content
Reach out to your administrator for access.
Overview
Visier's usage metrics offer insight into user actions in the application. For example, find out what users click on, the rooms they navigate, and content they create. With this information, give users the content and support they need to be successful in Visier.
Usage metrics track active users, sessions, user actions, analyses, groups, key groups, and visualization impressions. Usage only includes your users; users from Visier, such as Visier Technical Support, are not included in your usage data.
You can answer these questions with usage metrics:
- Which users are accessing Visier?
- How often are users logging in?
- What analyses are users viewing?
- What parts of the application are users accessing?
- What metrics and dimensions are used the most?
- How much time do users spend looking at a visualization?
Tip:
- To learn more, take the Visier University eLearning course: Introduction to Studio, How do I monitor usage?
- Usage tracks user actions associated with analyses, groups, and key groups. For tracking data exports and other actions not included in usage, see Application Logs.
View usage data
The USAGE - All Content content package includes a Monitor Usage Guidebook topic, metrics, dimensions, concepts, and analytic objects. To find usage in Visier:
- In the Guidebooks room, click Visier People > Monitor Usage.
- In the Explore room, click the Metric picker > See all metrics > Usage.
- In a project, in Model, select Analytic Objects, Dimensions, Concepts, or Metrics, and then filter the list by Tags > Usage.
View details for usage
The Detailed View for usage metrics provides a list of the activity for the active users and sessions, in contrast to a list of the users or their sessions directly. For example, the Detailed View on the Active Users metric with a value of 16 shows a list of 500 activities for the 16 active users for the selected period of time.
Fix unknowns for usage
When viewing usage metrics, such as Active Users or Registered Users grouped by Employee dimensions, you might see employees in the Unknown category. This can happen if an employee's Employee ID does not have a value.
To specify Employee ID for each user, you can manually edit user details or use dynamic lookup. For more information, see Edit User Details and Set Up Dynamic Lookup.
- If using manual editing, users may be Unknown if the Employee ID you configured does not match the Employee data you provided.
- If using dynamic lookup, users may be Unknown if the user hasn't signed into Visier yet or if the user doesn't exist in the Employee data you provided. The number of users categorized as Unknown decreases as users log in to the Visier application.
Provide access to usage data
Usage data is available to administrators. However, administrators can control and customize access to usage data through permissions. To provide other users access to usage, do the following:
- Add usage access to a permission.
- In a project, on the navigation bar, click Security > Permissions.
- Select a permission in which to add usage access or create a new permission.
- In Data Security, click Add Access, and then expand Subjects. Select Content, Session, User, Visualization Base Content, and Visualization Impression.
- Click Finish.
- Add population access and data access. For more information, see Refine Population Access and Configure Data Access.
- Add the content package USAGE - All Content to a permission.
- In a project, on the navigation bar, click Security > Permissions.
- Select a permission in which to add usage access or create a new permission.
- In Content Packages, click Add or Remove Content Packages.
- Select USAGE - All Content.
Tip: Alternatively, create a new content package to select specific usage analyses, metrics, dimensions, key groups, and guidebooks to provide access to. For more information, see Create a Content Package.
- Click Save.
-
After reviewing your changes, publish your project to put the changes into production. .
Preview usage data
Usage data updates weekly on Sundays. In Studio, you can access sources and a data category that contribute to the usage data version every week.
In the global workspace, navigate to Data > Sources to view usage sources. Because usage doesn't involve sending data to Visier, the sources have 0 files loaded and 0 records. However, usage data generates from user activity in Visier and updates in the production data version once a week.
In a project, navigate to Data > Data Categories to view the usage data category. Because usage is a special data category, you cannot set the data version directly.
If you change the primary data category's settings and want to preview it with the current usage data version, select the primary data category and set the data version there, as described next.
-
In a project, on the navigation bar, click Data > Data Categories.
-
In the Data Categories room, click the Actions button
 on the right side of the primary data category, and then click Edit.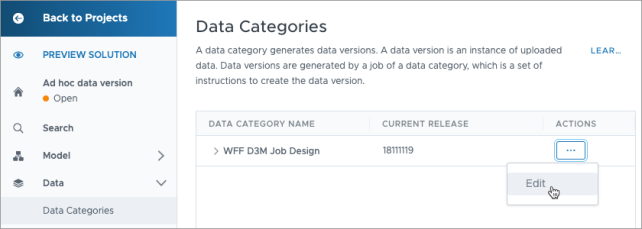
- In the Release tab, click the Release behavior list, and select Custom release.
- In the data version number, type data=DV#,usage=DV#; for example, data=12345678,usage=23456789. To find the current usage data version, in Data Categories, look at Usage> Current Release.