
Detailed View Visual
View a list of subject members or event occurrences that make up a given population.
Access requirements
Permission with these capabilities: View Details
Reach out to your administrator for access.
Overview
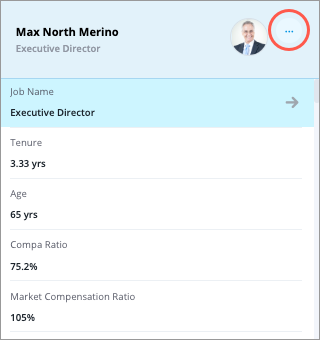
The Detailed View visual shows the subject members or event occurrences for a given population. In Detailed View, you can select individual members or occurrences to review their attributes and attribute values.
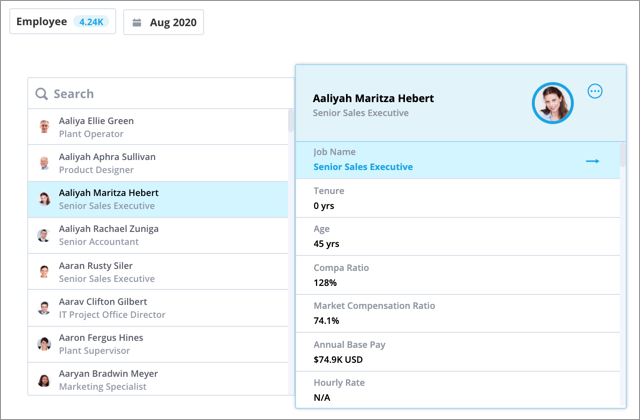
Use Detailed View to validate your data as well as identify specific individuals of interest in a population.
Note:
- Depending on the metric that you've selected, the Detailed View population may not match the metric value. For simple count metrics (such as Headcount), the population should match the metric value. You may see a discrepancy between the population and the metric value for metrics that involve more complex calculations (such as Time Since Promotion).
-
The numeric attributes displayed in the Distribution visual are configured in View Details in Studio. If View details is not configured for the analytic object, the Distribution visual will return an error.
- Administrators can select and organize the list of attributes displayed in Detailed View. For more information, see Configure View Details.
Access the Detailed View visual
Prerequisites: To perform this task, you must have the View Details capability.
To access Detailed View, do one of the following:
- Click the View Details button
 in the Insights tab of the Info panel.
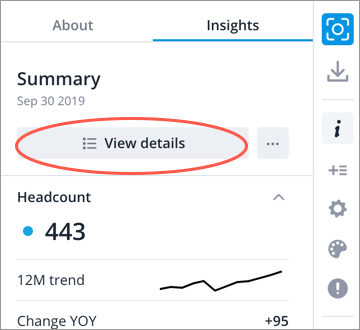
- If your visual contains more than one metric (Quadrant visual, Relationship visual, and metric comparison), click the More actions
 button in the Insights tab of the Info panel, and select View Details for any secondary metric of interest.
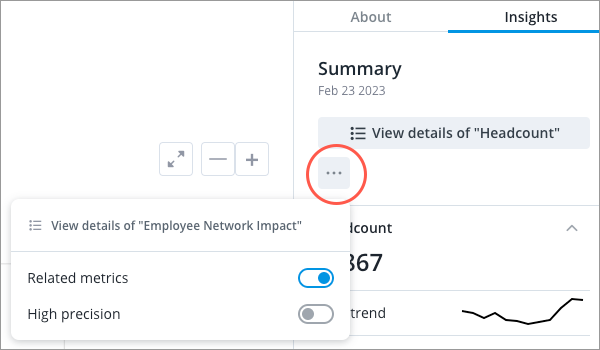
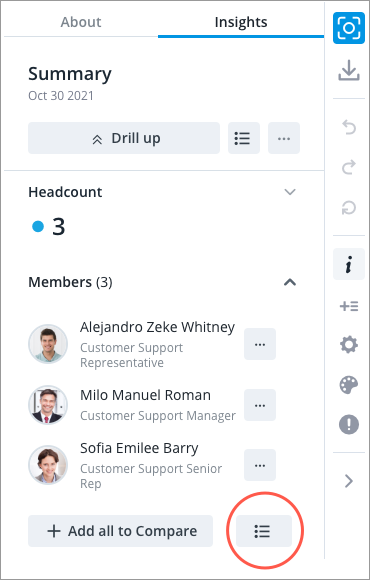
- Click the View Details button under the Members section in the Insights tab of the Info panel.
- Right-click on a chart item or data point to open the Visual Item Actions menu. Find actions that will allow you to quickly interact with points of interest. Actions include drilling up or down to view different levels of your data and accessing the Detailed View visual to see a list of subject members or event occurrences that make up a given population.
Note:
- Select a data point before clicking View Details to see the subject members or event occurrences for a given population.
-
For the Members section to appear, the following criteria must be met:
- Users must have the View Details capability.
- There must be five or fewer members in the population for the selected data point.
- The visual does not contain any comparisons. For example, the Members section will not appear if you are comparing metrics or groups.
- The visual does not contain any metrics that use a calculation concept. For example, Total Cost of Workforce or Movement metrics.
Additional actions in Detailed View
Try these additional actions to gain further insight.
Data exploration
Conduct further analysis of the selected member in another visual.
- Click the More actions button in the header.
- Do one of the following:
- Click Add to compare to add the selected member to the Compare room. The Compare room lets you analyze the attribute values of individual subject members and groups side by side. For more information, see Use the Comparison Grid.
- Click View history to explore the attribute values for the selected member in the History visual. For more information, see History Visual.
- Click View Career Path to see the various jobs an employee can have as they progress within your organization. For more information, see Career Paths Visual.
Download Detailed View data
- Export the Detailed View data as an XLSX file by clicking the Download visual button
 on the Visual Actions menu, and then click Spreadsheet.
Note:
The Spreadsheet option will be unavailable if the export exceeds the following maximums. Decrease the amount of data displayed before downloading again.
- Table visual and Aggregated Data Exports can contain up to 100,000 cells.
- Detailed View visual and Detailed Data Exports can contain up to 1,048,576 rows or 7.5 million cells.
Capture Detailed View
Save the visualization to revisit historical insights by clicking the Capture button ![]() on the Visual Actions menu. Once captured, you can add the visualization to an analysis.
on the Visual Actions menu. Once captured, you can add the visualization to an analysis.
Report a data issue
Report data issues such as incorrect values or missing events for an administrator to review.
Prerequisites: To perform this task you need the Flag and Fix capability. Contact your administrator to enable this capability. For more information about this workflow, see Report a Data Issue.
To report a data issue for a simple attribute:
-
Right-click the attribute value you want to report and then click Report a data issue.
To report a missing event for subject members such as employees, candidates, and requisitions:
-
Click the More button
in the header of the subject member you want to report a missing event for and then click Create event.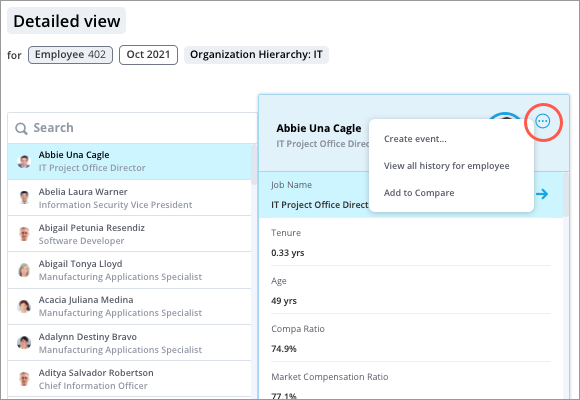
To report a data issue or request the removal of event occurrences such as employment starts, hires, interviews, and recognition:
-
Click the More button
in the header of the event occurrence you want to report an issue for and do one of the following: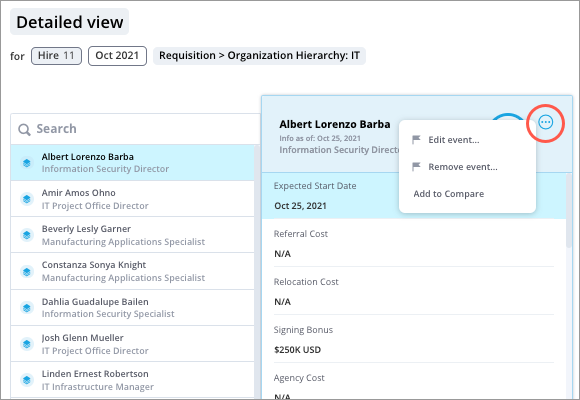
- Click Edit event to report a data issue such as an incorrect date.
- Click Remove event to request the removal of an incorrect or duplicate event record.
How the Detailed View population is determined
The population that you'll see in Detailed View is specific to the data security access that you've been given. This means Detailed View may be unique to each user. For more information, see Detailed View Across Multiple Permissions. The ability to see actual values for specific attributes is also determined by your security access.