Visual Types
Explore the different visual types available in the solution and select the right visualization for the right situation.
Overview
To change the visual type:
- Click the Visual picker in the visual title.
Note:
- The visual types that are available depend on the metric that you have selected.
- The selected metric changes if you select an incompatible chart type.
You can choose from a large selection of visual types. If you aren't sure where to begin with picking a visual type, this article provides guidance based on your analysis goals.
Tip: To learn more, take the Visier University eLearning course: Choosing the Right Visual.
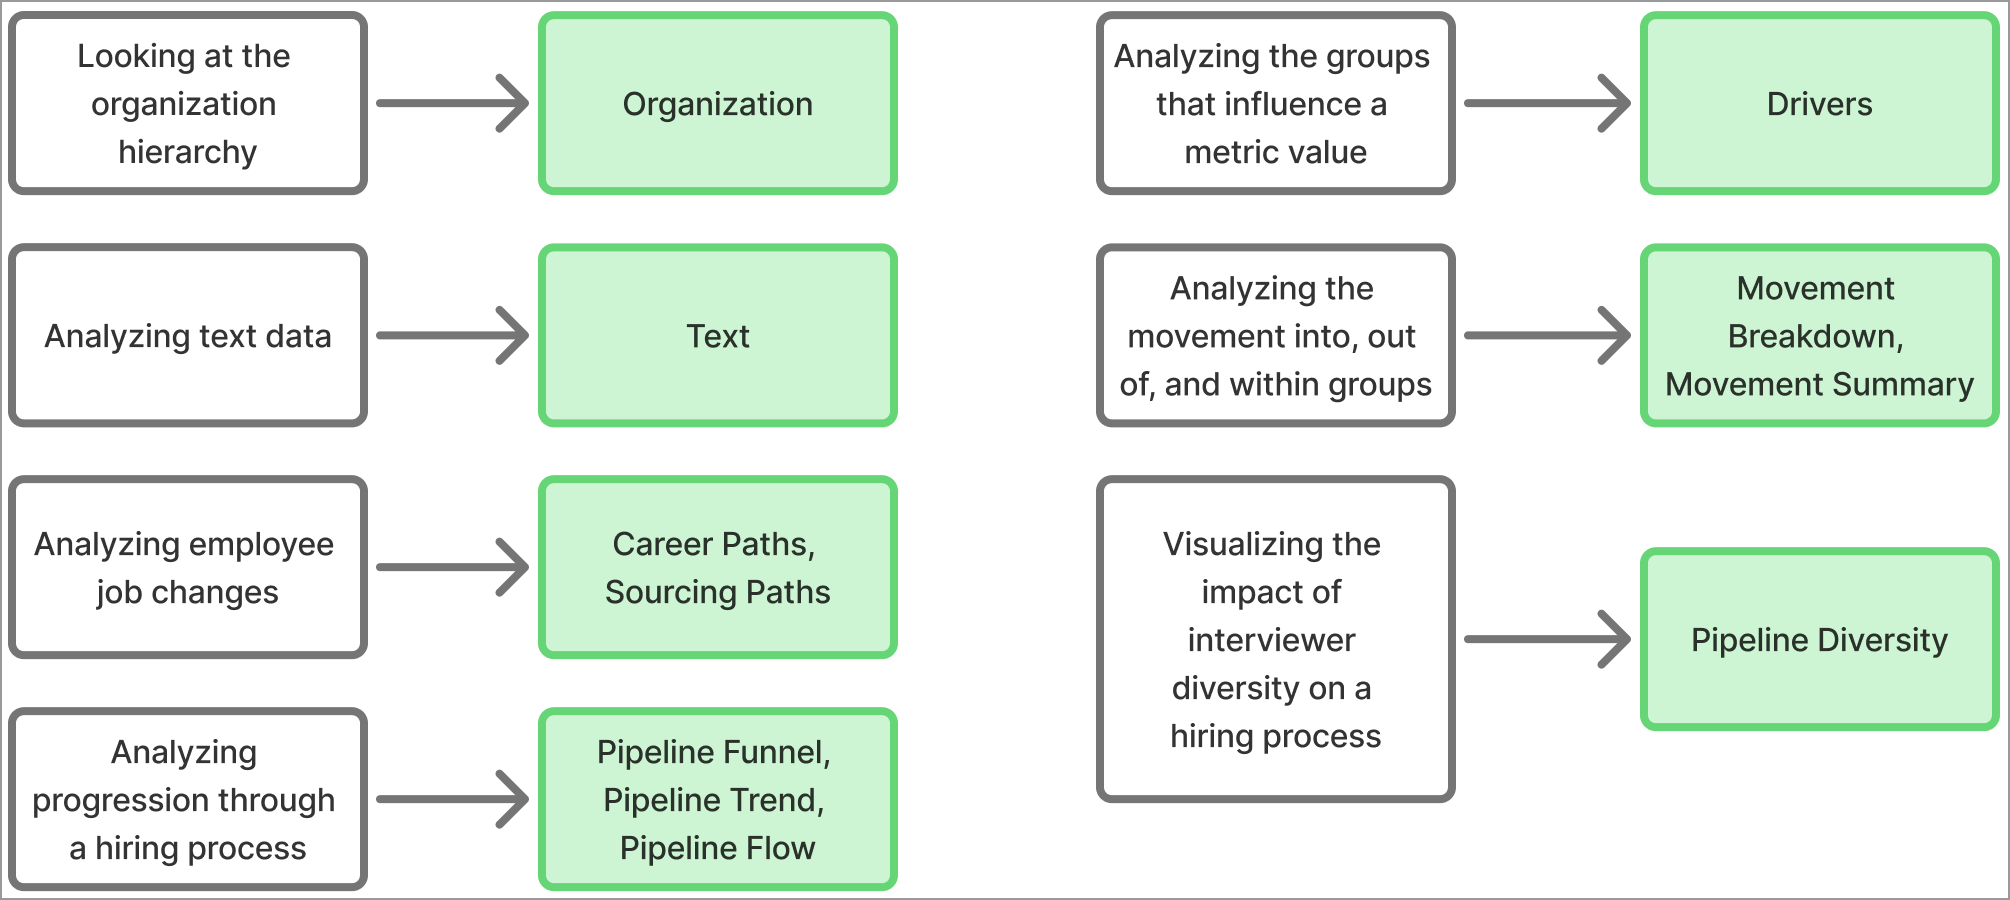
Specialized visuals
Some visual types are highly specialized for specific analytic areas, such as organization hierarchies or text data. Start here to determine if a specialized visual answers your analytic question.
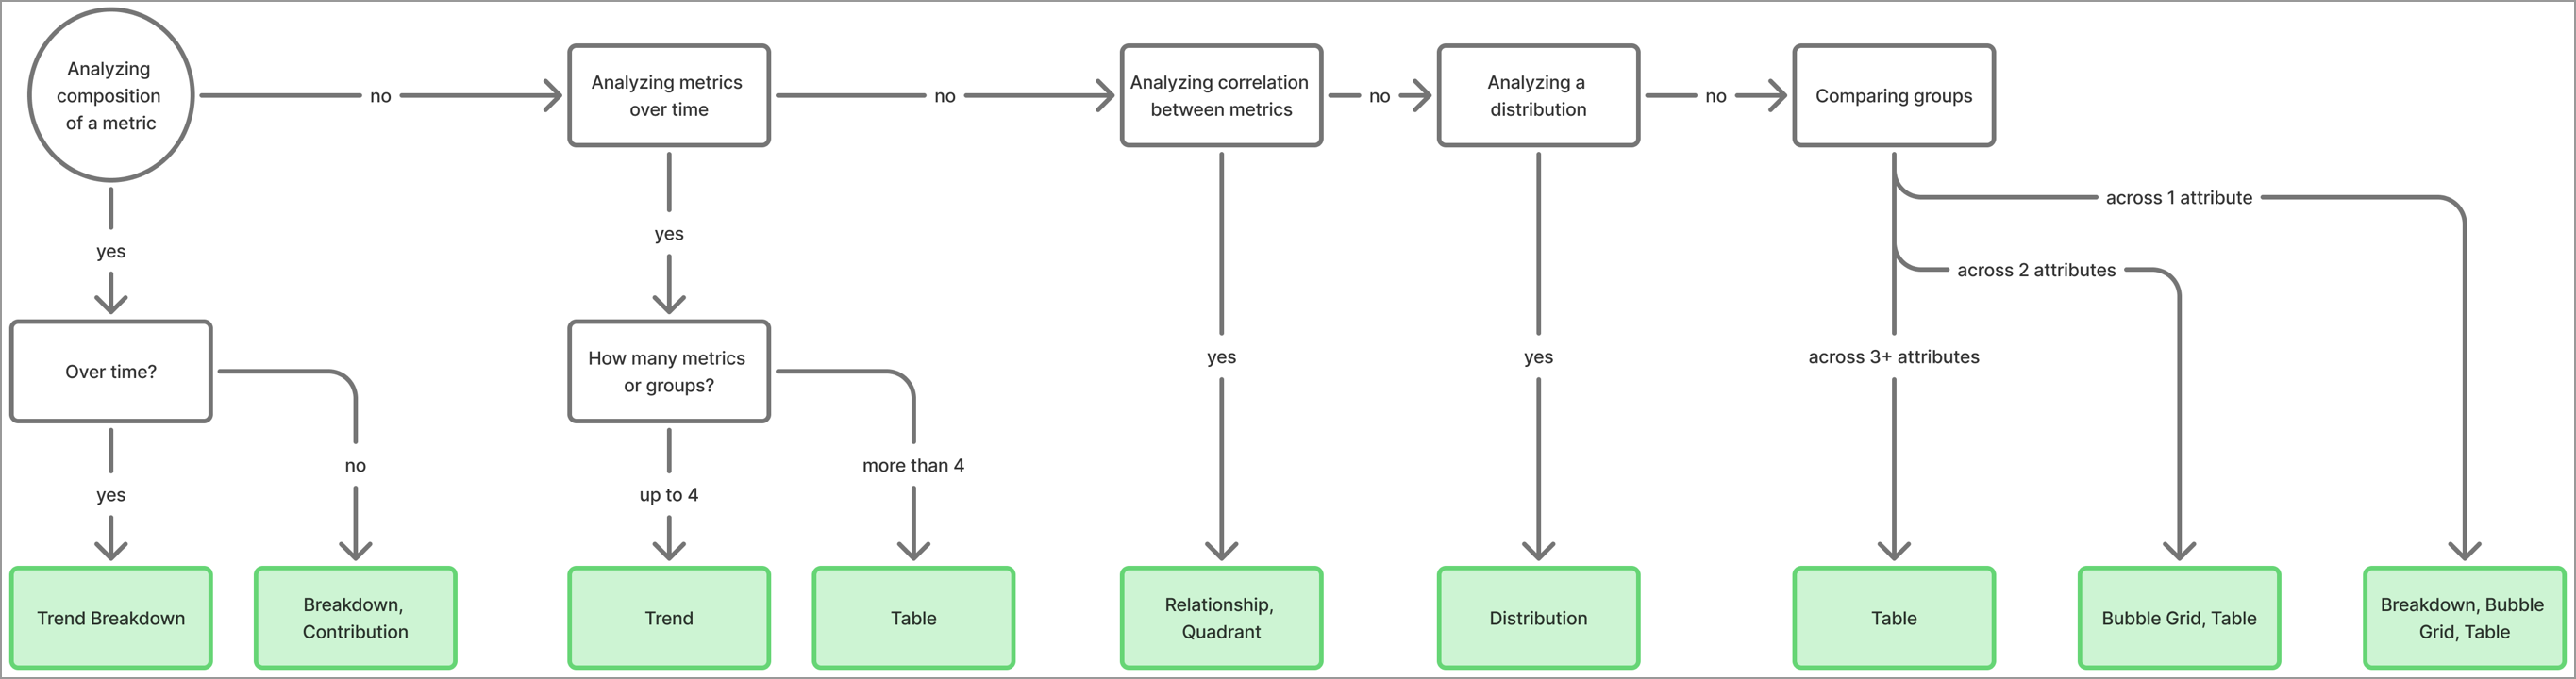
General metric visuals
If none of the specialized visuals match the analytic question, there are more generic visuals you can use based on what you want to analyze. Consider the following criteria to choose a visual type:
- Are you analyzing the composition of a metric? The composition is the groups that contribute to a metric value, such as the organizations that contribute to Headcount.
- If not metric composition, are you analyzing metrics over time? Without composition, you're looking at how a metric's value changes from period to period, not how each part of the metric changes.
- If not metrics over time, are you analyzing the correlation between two or more metrics? Correlation is how two or more metrics relate to each other, such as their relationship or common attributes.
- If not correlation between metrics, are you analyzing how a population is distributed over an attribute? Distribution shows the range of attribute values for a group, including the mean and median.
- If not distribution, are you comparing groups? Comparison shows the differences in metrics values for the attributes you're interested in.
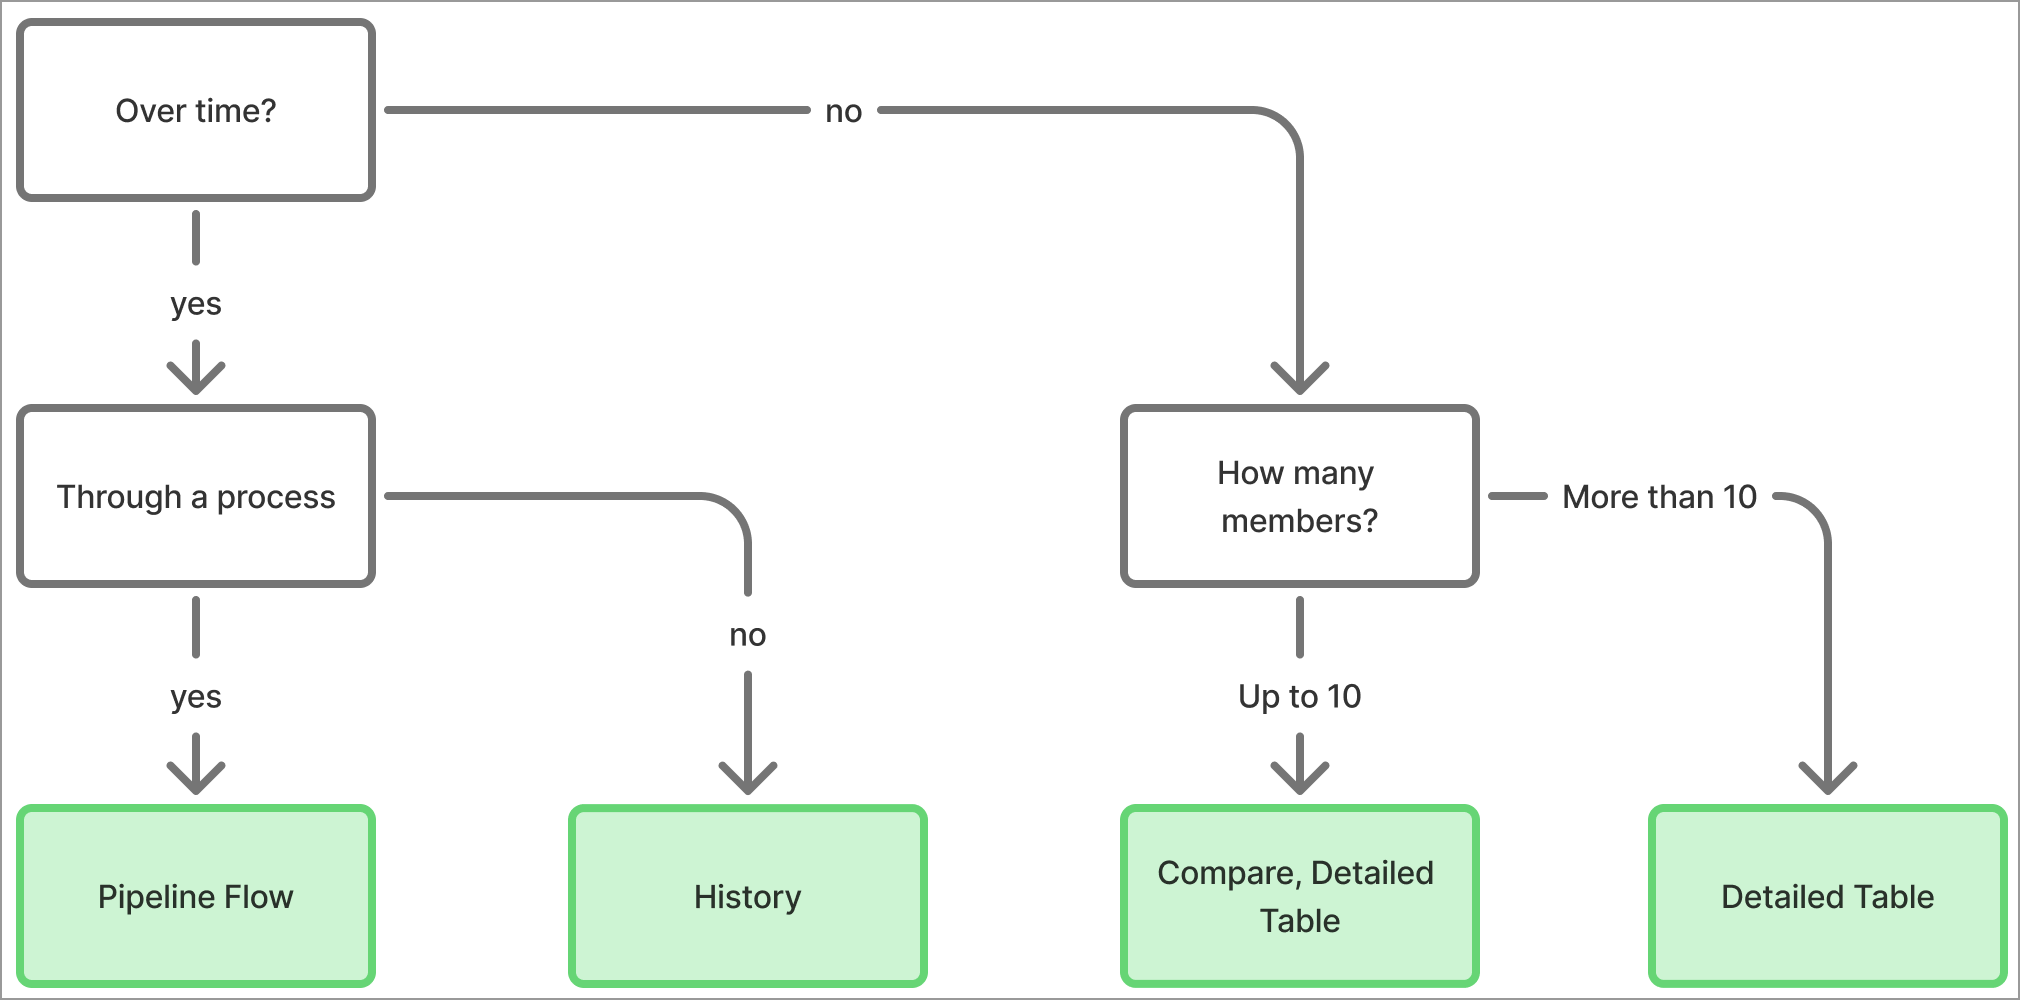
Individual member or event visuals
Some visuals analyze individual subject members or events. Rather than looking at aggregated metric values, you can analyze individuals in your data. For individuals, consider whether you're interested in that individual's history over time and the volume of members to analyze to pick the best visual type.