
Plan Model Design
Learn about the design principles behind creating a plan model and apply them to create your own.
Overview
In this guide, we'll walk through the design decisions that were considered by Visier experts when building a new plan model. As an example, we will build a plan model called Sales Productivity model focused on planning for the number of sales representatives needed to hit revenue targets. Understanding the design decisions behind building a plan model is key to building your own. If you have additional use cases beyond the out-of-the-box planning content in Visier, follow along with this guide to learn how you can create new plan models to accomplish your organization's goals.
If you aren't familiar with plan models, take a moment to read Plan Models.
Design considerations
In this guide, we'll explore the following key design considerations when building a plan model:
- Determine your use case
- Decide what objects to create
- Make calculation decisions
- Deep dive: Build upon the core model
- Connect your plan model to analytics
Determine your use case
The first step to creating a plan model is to determine your business question and connect it to a logical model structure. We will do this by mapping out the model's narrative—the inputs, calculations, and outputs—to establish a clear design we can guide our model creation with.
Questions to consider
Determining your use case and mapping your model's narrative requires a lot of decision-making and forethought. By sketching out the high-level logic and validating your data sources before building, you ensure your design choices serve the larger goal, resulting in a model that is both logical and easy for users to understand. To determine your use case, ask yourself the following question:
What is the core business question this plan model must answer?
Frame the business question as a sentence that can be answered with a numerical value; for example, how many employees are in my organization? Think about who wants the answer to this question. Frame this as the core audience that will benefit from the plan, such as HR leaders, line managers, or finance teams.
In this example, we want to build a model to plan for sales productivity. We want to figure out exactly how to hit our sales goals through different factors to drive revenue. We want this model to connect factors we can control—such as how many people we hire, how much we spend on training, our average closing rate—directly to the revenue we want to make.
With this idea in mind, our business question is: What workforce is needed to hit our revenue targets?
Using this business question, we can draw out the model's narrative—the inputs, calculations, and outputs—to establish a clear design to guide model creation with. To determine your model's narrative, ask yourself the following questions:
What are the primary components of the plan model, and how do they relate to one another?
When building a plan model, we need to think about the structure. This includes the model's foundational components and the underlying logic that connects them. Ask yourself what values you'll need to start with, what final answers you want to see, and what math connects those pieces together.
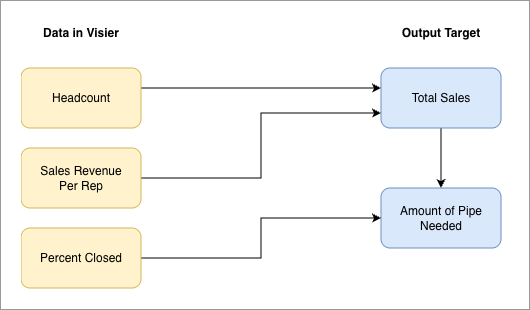
At the core of our Sales Productivity model, we want to know the number of employees in the organization and the revenue they make so that we can generate a key output for total sales revenue. With this in mind, we can see from our diagram below that our core components are Headcount, Revenue per Sales Representative, and Total Sales Revenue. To make our model more robust, we also want to build upon these core components and include the percentage of deals closed, including both sales won and lost, so that we can calculate the sales pipeline needed.
What are the inputs the plan model needs?
This includes existing data and user assumptions. For our Sales Productivity model, we need existing data such as win rates, sales lost, sales pipeline generated and matured, and the time it takes to close deals. For user assumptions, we'll need to incorporate planned headcount changes, and changes in generated revenue, win rates, and pipeline.
What data is actually available to support the plan model's calculations?
Can you source the necessary data for the metrics the model needs? If not, you may need to load that data. For our Sales Productivity model, we need data for metrics such as headcount, win rate, and historical revenue.
Decide what objects to create
Now that we have determined our use case, we can move on to deciding what objects to create. The goal is to establish the essential inputs (the foundational data) and the plan items (the calculated results) that drive your planning analysis. For more information on these components, see Plan Inputs and Plan Items.
We recommend starting by creating your core assumptions in your plan model, then use a simple formula to create your primary projection based on those assumptions. This approach ensures a clear and logical calculation flow. In this section, we will demonstrate the process of creating the three core plan items for our plan model: Headcount, Revenue per Sales Rep, and Total Sales Revenue.
Core metric
When you create a new plan model, the first step is selecting a core metric. This selection acts as a shortcut to quickly build the foundational pieces of your plan. Once a metric is chosen, the model automatically streamlines the initial setup by creating two key components:
- An input that directly references the selected core metric.
- A plan item whose baseline value is linked to this newly created input.
Since our model is focused on sales representatives, we will choose Headcount as the core metric. Once we click create, the model will automatically generate an assumption plan item called Headcount. As you'll learn in the next section, an assumption is a user-editable cell in the planning grid. This means our planning grid will start with our actual historical headcount figures, which planners can then adjust and use as a planning lever.
This initial configuration creates our first plan item for us and provides us with a starting point by bringing our core metric into the plan model. For more information on the plan model's core metric, see "Core metric" in Plan Model Settings.
Plan items
Now, we need to create our other two core plan items: Revenue per Sales Rep and Total Sales Revenue. Plan items are the building blocks of the plan model, they represent the specific elements you want to track and measure in your plan.
You must decide whether each plan item will be an assumption or projection. As a refresher, let's define each:
- Assumption: These are cells in the planning grid where planners directly input assumed or potential values.
- Projection: These are cells in the planning grid whose values are derived from a formula that uses other existing plan items and inputs.
Here are simple guidelines on when to create an assumption versus a projection: if a plan item fits all the listed criteria for one category, you should use that type.
Create an assumption if:
- You need a control lever. The item represents a factor the user can and should change to explore different scenarios.
- The value is based on external judgment. The value relies on a strategic decision, market outlook, or a forecast that isn't directly calculated from other plan items.
- The value needs to be seeded. You want to provide a starting point from historical data, but you expect the user to override or adjust it for future periods.
Create a projection if:
- The item's value is derived mathematically from one or more other plan items (assumptions or other projections).
- The value is non-editable. You want to prevent the user from manually changing the number.
Based on these guidelines, let's decide how we want to build each plan item. We want to know how much revenue each employee generates, we know we have an existing metric called Sales Revenue Closed per Sales Employee that has the necessary data. We want planners to be able to play with this value and change it. Therefore, we will create an assumption called Revenue per Sales Rep.
Next, we want to know the output of total sales based on the headcount and revenue. Since this is not a number we want planners to change directly, and instead depends on other items already in our plan model (Headcount and Revenue per Sales Rep), we will create a projection called Total Sales Revenue.
The table below summarizes the three core objects we will create:
|
Plan Item |
Type |
Formula Logic |
Rationale |
|---|---|---|---|
|
Headcount |
Assumption |
Automatically generated and seeded from the core metric. |
A key lever for planners to make headcount changes. |
|
Revenue per Sales Rep |
Assumption |
Seeded with our existing Sales Revenue Closed per Sales Employee metric. |
A key lever for planning sales productivity. Seeded with historical data for a realistic baseline. |
|
Total Sales Revenue |
Projection |
Headcount multiplied by Revenue per Sales Rep. |
The first primary output. Calculated from our other existing plan items. |
For now, this is a good starting point for object creation. We will build more pieces of the model later on.
Make calculation decisions
Now that we've determined which plan items to create, we need to define their value calculations. This determines how we write the plan item formulas. To write a plan item formula, we must be familiar with the Visier Modeling Language and the structure of a plan item formula. If you aren't familiar with the Visier Modeling Language, take a moment to read Visier Modeling Language (VML).
Let's examine the key considerations that guide our calculation decisions:
How should we calculate Headcount?
Since the Headcount assumption was automatically created by the plan model, its formula was created for us. Headcount is automatically "seeded" from the core metric. Seeding uses plan inputs to pull existing, historical values from your metrics into your plan model. The formula is written as follows:
prevWithSeed(Headcount_Input)
In this formula:
prevWithSeedreturns the value from a previous time period. A "seed" is an initial value or starting point (from your historical metric data). It's used when there isn't a prior value to draw from in your plan, such as at the very beginning of a time period. The seed provides a default or baseline value, allowing calculations even when historical plan data is absent.Headcount_Inputis the plan input that is pulling in the historical Headcount metric data. We will learn more about plan inputs in the next section.
How should we calculate Revenue per Sales Rep?
For this assumption, we want to seed it with our existing Sales Revenue Closed per Sales Employee metric. To do this, we'll need to create a metric plan input. Plan inputs are essential to give your model's assumptions a starting value using your historical metric data. This provides a realistic baseline that planners can immediately trust. By incorporating metric plan inputs into your assumption formulas, you ensure that the historical values are automatically carried forward month after month.
Step One: Create a plan input
We know we have an existing metric called Sales Revenue Closed per Sales Employee that has the necessary historical data. Therefore, we can create a plan input in our model with a metric input type and select Sales Revenue Closed per Sales Employee as the metric.
Step Two: Add the input to the assumption formula
Once the input is created, we can add it to the formula of the Revenue per Sales Rep assumption so that it is seeded with the metric data. We want to have at least 12 months of historical data. With the above information, we can write the following formula:
shift(back(months(12)), Revenue_per_Sales_Rep, Revenue_per_Employee_Input
This formula uses the shift function to return a value using three parameters:
- First, a parameter defining how far to shift in time. In this formula, we used
(back(months(12))to look 12 months in the past. This helps with seasonality as sales representatives sell different amounts each month, so by looking backwards 12 months we can see what the average was for specific months. - Second, a value for planned periods. In this formula, we used
Revenue_per_Sales_Repto return the plan item value from 12 months ago (if 12 months ago still lands in a planned period). - Third, a value for unplanned periods. In this formula, we used
Revenue_per_Employee_Inputto return the historical metric data logged from 12 months ago (if 12 months ago does not land in a planned period). This means if we do not have a previous month in the plan (this is the first month of the plan), then it will look at the plan input we created to pull in the historical metric data.
All done! We've successfully created a plan input to seed our Revenue per Sales Rep assumption with existing data from our Sales Revenue Closed per Sales Employee metric.
How should we calculate Total Sales Revenue?
We want to know the output of total sales based on the headcount and revenue. Since this is not a number we want planners to change directly, and instead depends on other items already in our plan model, we can simply multiply headcount by revenue per sales rep in the formula.
Headcount * Revenue_per_Sales_Rep
Should I choose sum or weighted roll up?
When creating your plan items, you can choose between sum or weighted roll up. This determines how a value should behave when it is summed up across different dimensions (such as different sales locations or months). Here are some considerations we made when deciding the appropriate aggregation methods for our plan items:
- Sum: Most items (such as Total Sales Revenue) should simply add up when viewed at a higher level (e.g., the sum of monthly revenue equals quarterly revenue).
- Weighted average: Some values (such as Revenue per Sales Rep) should be weighted by another factor when aggregated. For instance, when calculating the company-wide average revenue per rep, you should weigh it by the actual Headcount in each location to get a true overall average (assuming sales reps are the only included headcount).
Deep dive: Build upon the core model
Now that we've created our core plan items, related inputs, and decided on their calculations, we can dig deeper to build upon the model and add more advanced components. Follow along in this section to see how we incorporate components of our sales pipeline and account for time delays in our plan model to make it even more robust.
Incorporate sales pipeline
We want to incorporate the realistic components of our sales pipeline, such as lost revenue and total pipeline consumption. This requires introducing the following new plan items:
- Sales Win Rate (Assumption): A new assumption for our expected Sales Win Rate. This is the key driver that determines how much pipeline is needed to achieve our revenue goal. We can seed this by creating a metric plan input for our existing metric called Sales Win Rate (Sales Process). Planners can adjust this number to test different scenarios.
- Sales Lost (Projection): This projection value answers the question: If we won $X in revenue, how much did we lose to get that result? We can use our existing Total Sales Revenue projection and the newly created Sales Win Rate assumption to calculate the amount of revenue that was lost in the same period. The formula is written as:
(Sales Win Rate/Total Sales Revenue) − Total Sales Revenue - Pipeline Consumed (Projection): This projection value tells us the total volume of deals that closed (were won or lost) during the period. Pipeline Consumed should be calculated as the sum of all successful deals and all failed deals, using our existing Total Sales Revenue projection and newly created Sales Lost projection. The formula is written as:
Total Sales Revenue + Sales Lost
By adding these items, our plan model becomes a dynamic tool for understanding how much pipeline input is truly required to achieve a desired revenue output.
Incorporate time delays for a maturing sales pipeline
Realistic planning requires accounting for time delays, especially in sales where pipeline doesn't close immediately. Let's build on our model further to introduce the concept of a maturing pipeline to accurately reflect the average sales cycle duration.
A critical question is: How long does it typically take for a deal to move from creation to close?
To answer this, we must first source an existing metric that measures the average sales cycle, such as Time to Close Won. This duration determines the necessary time shift you must apply to your pipeline figures. For example, if your Time to Close Won is 5 months, the pipeline generated today won't be ready to close until 5 months from now.
To create a realistic source for our wins and losses, let's introduce the following new plan items:
- Pipeline Generated (Assumption): An assumption for the value of new deals opened. We will seed this by creating a metric plan input for our existing metric called New Sales Opportunities Amount (Sales Process). Planners can adjust this number to test different scenarios.
- Matured Pipeline (Projection): A deal doesn't close the month it's created, it takes time to move through the pipeline. Matured Pipeline is a projection that brings pipeline value forward in time, making it ready to be counted as a potential win or loss. For example, let's say your time to close is 5 months. To find out how much pipeline is matured this month, this projection looks back over the past year to see what was generated exactly 5 months ago. That older, now-ready pipeline is the total amount available to close in the current month. In simple terms, we are setting an "expected close" month for every deal when it first enters the plan, ensuring that all our projections for wins and losses are based on our actual sales cycle. The formula is written as:
perPeriod_sum(back(months(12)), if(periodsFromNow() = floor (Time_to_Close /daysInPeriod())) Pipeline_Generated else 0, 0)
Connect your plan model to analytics
Now that we have designed and built our plan model, it's time to connect it to analytics. If you want to analyze your new plan items in Explore to create analyses and charts, you will need to create and attach an associated plan metric. Think of a plan metric as the analytical representation of your plan item's data, making it accessible for analysis. Plan metrics are not automatically created when you create a new plan item, you will need to manually create and attach a corresponding plan metric for each plan item that you intend to use for analysis or to display in charts. This section explains the two-step process required to connect our plan's results back to analytics. For more information, see "Plan metrics" in Plan Items.
Step One: Create the plan analytic object
Our new plan model exists in its own workspace. To make its data visible for analytics in Explore, we must create a plan analytic object. The plan analytic object acts as the container and bridge for all data within our specific plan model and establishes the connection between our plan model and analytics. Let's create this object and associate it with our newly built Sales Productivity model.
To create a plan analytic object:
- In a project, on the navigation bar, click Model > Analytic Objects.
- Click Create Analytic Object.
- In Analytic object type, select Plan Analytic Object.
- Type a display name. Our display name is Sales Productivity.
- Select your base plan model. Our plan model is Sales Productivity Model.
- When finished, click Create.
Step Two: Create and attach a plan metric
Once the plan analytic object is created, we can create corresponding metrics and attach it to the plan items we want to visualize in analytics. Let's walk through an example for our Total Sales Revenue plan item.
To create a plan metric:
- In a project, on the navigation bar, navigate to Model > Metrics.
- Click Create Metric.
- Type a display name and description. Our display name is Total Sales Revenue (Sales Productivity Plan).
- Click Create.
- In the Formula box, type a metric formula. Our formula is
on Sales_Productivity_PlanAnalyticObject aggregate sum (Total_Sales_Revenue). For more information on how to write plan metric formulas, see "Plan metric formulas" in Plan Items. - Click Validate. This verifies that the metric formula is valid.
-
In the Settings tab, set the data type, analytic object, and additive type.
Tip: Metric setting guidance
- Data type: What kind of value is it? Is it a currency (like Total Sales Revenue), a number (like Headcount), or a percentage (like Win Rate)?
- Analytic object: Set this to the plan analytic object you created.
- Additive type: How should this value combine across the organization and time? Is it additive (it should be summed up across different territories and time periods)? Is it non-additive (like a ratio or a rate) that requires a different calculation, such as a weighted average?
- Optional: In the Basic Information tab, type a description and explanation to provide further guidance about the metric.
- Attach the metric to the plan item:
- On the navigation bar, navigate to Planning > Plan Models.
- Select a plan model. We will select our Sales Productivity model.
- In the Model tab, select a plan item. We will Select Total Sales Revenue.
- In the Configure tab, under Baseline, select the plan metric you created in the Analytics metric dropdown. We will select Total Sales Revenue (Sales Productivity Plan).
- Repeat steps 1-9 for every plan item you want to create a metric for.
Next steps
We've created our Sales Productivity model! Using these design considerations, we extended the Visier solution by creating a new plan model to plan for sales productivity. We can now create plans using the model and analyze our plan metrics in the Explore room to compare plan values to actual business results. You can leverage the same principles, as demonstrated by the Sales Productivity model, to extend your planning content further to accomplish your organization's goals.