
Visual Actions Menu
A list of the actions you can perform when building your visuals.
Tip: Watch these videos for an overview of the Visual Actions menu and how to use the Visual Actions menu to customize your visuals.
The Visual Actions menu located on the right side of your screen allows you to build and customize visuals to suit your needs.
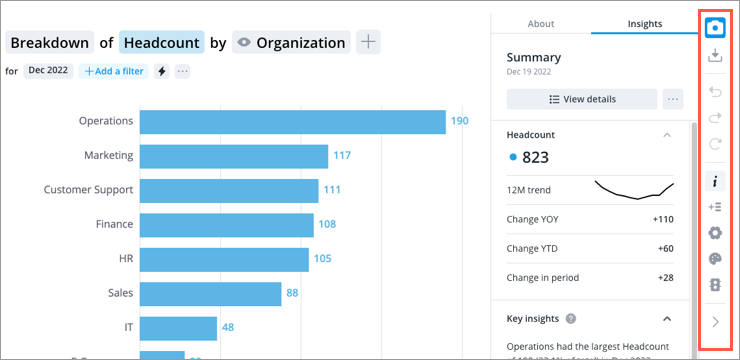
The following table describes the actions that are available.
Note: Actions will vary between visual types.
|
Action |
Description |
|
|---|---|---|
|
|
Add comparison |
Add an individual subject (such as employee, candidate, or requisition) or group to the comparison grid. For more information, see Compare. |
|
|
Annotate |
Add annotations to your visualization to provide additional context to the data. For more information, see Add an Annotation. |
|
|
Capture |
Create a capture of your chart. View your captures in Captures. For more information, see Captures. |
|
|
Change Colors |
Change the appearance of your chart by selecting a different color palette or changing the color of visual items such as metrics, trend lines, dimension members, and data points. For more information, see Change Colors. |
|
|
Compare To |
Compare metrics over time, across different populations, or against other metrics. For more information, see How to Create Comparisons. |
|
|
Download visual |
Export visualizations as a PNG, PPTX, or XLSX file to share or edit outside of the solution. For more information, see Download a Visual. |
|
|
Find on chart |
Find a specific employee in the Organization visual. |
|
|
Forecast |
Generate a forecast in the Pipeline Trend visual to predict when subjects will successfully complete a process. |
|
|
Info |
Show or hide the Info panel. For more information, see The Info Panel. |
|
|
Redo |
Redo an action that you've undone when building or viewing a visual. For more information, see Undo and Redo Visual Actions. |
|
|
Reset |
Clear all actions that you've made to the visual and start over. |
|
|
Settings |
Options are dependent on the visual type, but some examples include:
For more information, see Chart Display Settings |
|
|
Show paths to job |
Select a target job in the Career Paths visual to view the fastest and likeliest routes an employee can take to move to another job. |
|
|
Table settings |
Adjust the data that appears in rows and columns for the Table visual. |
|
|
Traffic Light |
Apply conditional formatting to a chart to quickly highlight metric values of interest. For more information, see Traffic Lighting. |
|
|
Undo |
Undo an action that you made when viewing or building a visual. For more information, see Undo and Redo Visual Actions. |