
Troubleshoot Data Discrepancies
Isolate the root causes of data issues and resolve common discrepancies.
Overview
While working in Visier, you may occasionally notice missing objects or values that appear unexpected or incorrect. While the data loaded into the platform may be accurate, the applied configurations, transformation rules, formulas, or user permissions can affect how that information renders. Use this guide to troubleshoot different data issue scenarios in Visier.
Incorrect metric values
If a metric is showing unexpected or incorrect values, the issue could be caused by the applied settings in the solution experience or configurations settings in Studio.
Investigate settings in the solution:
- Analysis context. If you're viewing a metric in the Explore room or in an analysis, there may be filters applied that alter the analysis context.
- Try removing the filters and groups bys, or checking Detailed View to find out what records are in the metric.
- Try changing the visual type to Trend and remove group bys. This approach helps you focus on the metric's values over time and identify where the data incorrectness originated. For more information about the Analysis Context toolbar, see Explore.
- Metric parameters. A metric's parameters can cause differences to the metric value you were expecting. For more information, see Change metric parameters.
- Trailing time. If the metric is using trailing time, the metric value may be different than you were expecting. For more information, see Change trailing time.
- Time period. If you notice missing data in a visualization, the time period may not contain any data. You can change the time period or change the visual type to Trend to verify if the metric is missing data for a specific time. For more information, see Change the Time Context.
Verify configurations in Studio:
- Metric formula. Check that the metric formula has the correct syntax, functions, and objects in the calculation. For more information, see Metric formulas.
- Metric dependencies. Investigate the objects that contribute to the metric to find out where the incorrect value is coming from. For more information, see Work With Metrics.
- In a project, navigate to Model > Metrics.
- Select the metric that has incorrect or unexpected values.
- In the metric, navigate to the Dependencies tab.
- In the Ancestors area, expand the list to find all dependent objects.
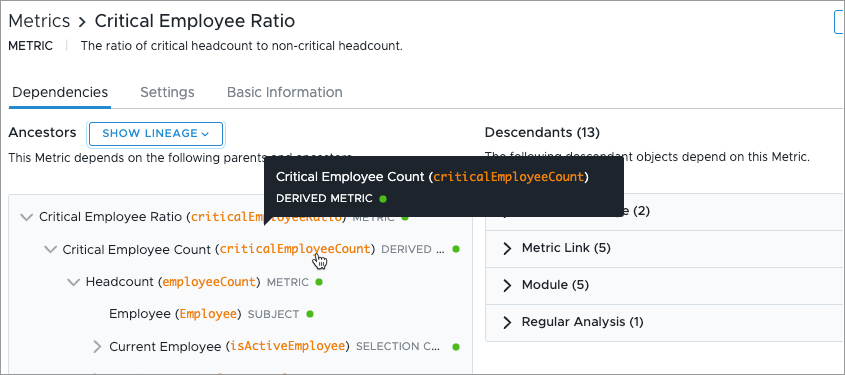
- Select an object and then click Go to Object.
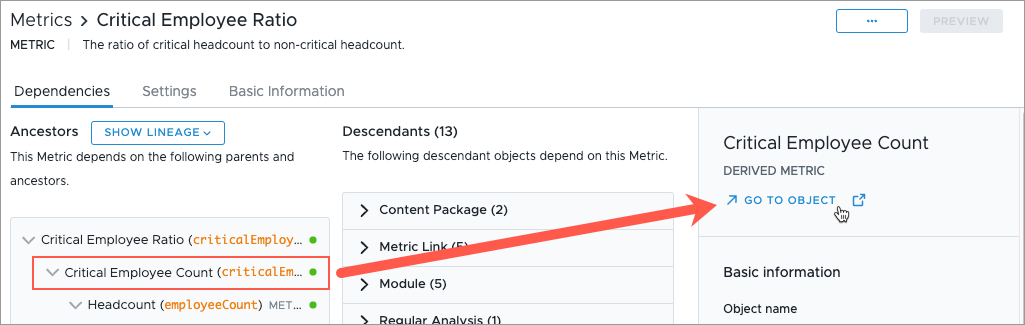
- In the object, click Preview and check that the object is returning the correct values. If the value is incorrect, do the following:
- If the object is a metric, check the formula syntax. For more information, see Visier Formula Language (VFL). If the formula is correct, investigate the metric's object dependencies.
- If the object is a concept, check the Configure tab. Each concept type has different configuration requirements. For more information, see Concepts. If the configuration is correct, investigate the concept's object dependencies.
- If the object is a property, check the property's mapping. The property might not be mapped to correct data column or there could be an issue with the extraction formula. For more information, see Mappings. If the mapping is correct, check your source files.
- Repeat steps 5 and 6 for all dependent objects.
- Sources. There may be an issue with the files in your source in Visier, such as blank or null values, incorrect column names, or incorrect date formatting. You can check your source files in the global workspace in Data > Sources > Select a source > Uploaded Files. For more information about sources, see Sources.
- If you aren't sure which source to check, expand the metric's object dependencies to the lowest level to find the source.
- In a project, navigate to Model > Metrics.
- Select the metric that has incorrect or unexpected values.
- In the metric, navigate to the Dependencies tab.
In the Ancestors area, expand the list until you reach the lowest level.
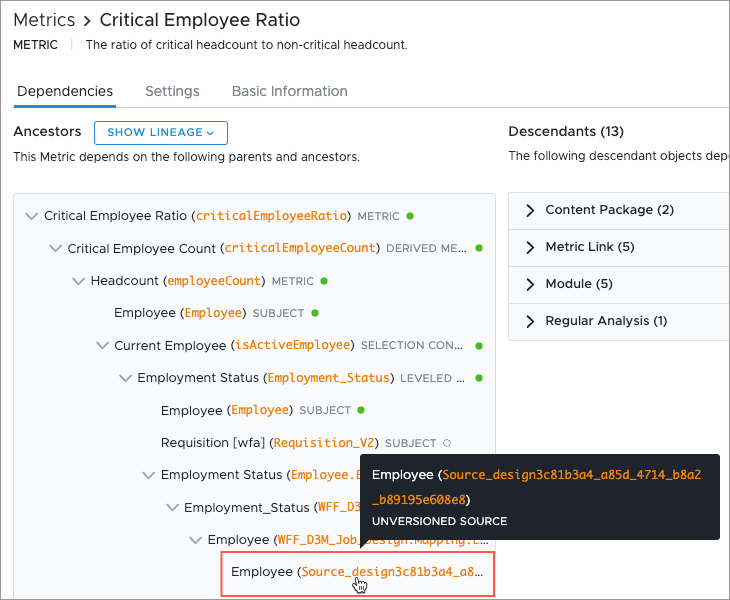
- If you aren't sure which source to check, expand the metric's object dependencies to the lowest level to find the source.
- Mappings. There may be an issue with a mapping, such as an incorrect override behavior, incorrect mapping data type, a property being mapped to the wrong column, or an extraction formula not covering all the intended cases. For more information, see Mappings.
- Debug Inspector. Your data may be transformed by rules after mapping, causing the mapping preview to differ from the data in production. For more information, see Debug Inspector. You can check data transformations in the Debug Inspector. It's common for the same issue to cause all records in a metric to display incorrectly. In the debug inspector:
- Identify a record that isn't correct in a metric and investigate how Visier transformed the record.
- Identify the stage at which the record was transformed incorrectly and find the cause.
Note: If the source files, metrics, and transformations all appear correct, contact Visier Technical Support.
Missing metrics, dimensions, or concepts
If you notice metrics, dimensions, or concepts that are missing from the Metric picker, Filter picker, or Group By picker, verify user permissions first, followed by Studio configurations.
Check user permissions:
-
If your user account in Visier doesn't have adequate data access to see the data represented by a metric, dimension, or concept, that object won't be visible in the solution experience. For more information, see Data and Content Security.
Verify configurations in Studio:
-
Object visibility. Confirm that the object visibility setting has Analytics selected. To do that, in a project, navigate to the object and then open the Basic Information tab. If Analytics is not selected, the object won't be available to users in the solution experience.
-
Metric formula. If a metric is missing, check the metric formula. For more information, see Work With Metrics. If the metric formula uses an object without available data or contains syntax errors, the formula is not valid and the metric isn't visible to users in the solution experience.
Tip: If there is no data available for a missing metric, you can access debug information in the Metrics list that can help you identify the cause. For more information, see Design objects with no data available.
-
If a concept or dimension is missing, check the configuration. For more information, see Concepts and Dimensions.
-
If you were expecting to group a metric by a specific attribute, you can check the subject associated with the metric and the attribute. The metric and the attribute must use the same subject to be used together in the solution experience. To find the subject associated with an object, do any of the following:
- For a metric, check the metric formula in the Formula tab.
- For a concept or dimension, check the Customize tab.
- Sources in Visier. You might be missing data for the object. For more information about sources, see Sources. If you discover that you're missing data, you can send data to Visier. For more information, see Bring Data In.
- Mappings from source data to objects in Visier. To check your mappings, in a project, navigate to Data > Mappings. The subject associated with the missing object must have a mapping and the relevant subject properties must be mapped. For more information, see Mappings.
Unexpected value in Unknown category
Note: For more information about why unknown values show up in visualizations, see Show or Hide Data Items.
If you're using a group by and notice an unusually high or low value in the Unknown category, try the following troubleshooting options.
Find all unknowns in the solution:
- In the Explore room, click the Visual picker and then select Breakdown. For more information, see Explore.
- Click the Settings button
 .
. - In the Chart settings panel, under Manage Items, turn on Show unknowns.
Result: You can now see all the unknown data items in the Breakdown visualization.
- Next, to find out which records are included in Unknown, select Unknown in the visualization.
-
In the Info panel
 , in the Insights tab, click View Details.
Result: You can now see the records that have an Unknown.
Investigate the source file in Studio:
- If your source data contains nulls, Visier's default behavior is to treat nulls as unknown values. To check the source data, in the global workspace, navigate to Data > Sources and then select the source that contains data for the group by with unknown values.
- If data is missing, you can send corrected data files for the source that contain the missing data. For more information, see Bring Data In.
- If the source file is correct, there may be an issue with your mappings.
In a project, navigate to Data > Mappings and select the correct mapping.
In the list of properties, find the property.
Do one of the following:
If it's a Map to column mapping, check that the correct column is selected.
If it's a Map to formula mapping, check that the formula is referencing the correct column.
Preview the mapping to confirm that the records are correct. For more information, see Preview Mapping Records.
- If nulls are correct but you don't want nulls to show up as unknown values in Visier, adjust your mappings in Visier to assign nulls to a value other than Unknown. Do one of the following:
- In a project, navigate to Data > Mappings and select the correct mapping. In the list of properties, select Map from formula for the property that contains nulls. Write an extraction formula to assign nulls to a different value.
- If the group by is a dimension, in a project, navigate to Model > Dimensions and select the correct dimension. In the Configure tab, in the table, hover over the Unknown row. Click the Edit button
 and change the display name from "Unknown" to a different name.
 - If the group by is a leveled dimension or parent-child dimension, in a project, navigate to Model > Dimensions and select the correct dimension. In the Configure tab, under Values, click Edit. In the Map unknown value dialog, select a different value and then click Save.
Incorrect system starts or terminations
If you encounter an incorrect number of system starts or terminations, there may be an issue in your data file. Before checking your files, you must understand system events in Visier. For more information, see Understanding System Events – How Visier Reconciles Employee Headcount.
Visier expects certain events in your starts and exits data. To validate your data, confirm that your files have the correct events. For more information, see Events to Include in the Employement Start and Employee Exit Files.
Unexpected attribute values
If you see an unexpected attribute value, such as a Job Name that should have updated from Developer I to Developer II but didn't, the most common cause is the data load. We recommend that most organizations send data to Visier every day and that the data is a monthly or weekly granularity. For more information about the frequency and granularity of data loads, see Frequency, Granularity, and Rolling Periods As They Relate to Your Data Extracts. You can also watch the video "Frequency, Granularity, and Rolling Periods" in Visier Organization Self-Serve Data Discovery.
An unexpected attribute value could also be caused by the override behavior in your mappings. Visier always takes the latest file, meaning that during the month, you may see daily changes to your data. At the end of the month, the last file of the month is taken and the previous daily files are ignored. You would not be able to see daily changes when looking back at the completed month. For more information about override behavior, see Override behavior.
If loading snapshot data, Visier groups dates together in the granularity that you send data in, such as weeks or months, and considers the events as occurring on the same day. Additionally, Visier always takes the latest file. This means that you won't necessarily see an event on the exact date that it happened. For example, let's say an employee's Direct Manager changed on January 16. Snapshot data records that event change as true on January 31 (the last file of January). Snapshot data is useful to correct data in the past, however, it is less accurate, and may cause you to see unexpected attribute values in Visier.
If loading data through connectors, you may find that your latest extraction job didn't include values that you expected. To resolve this, you can do a full extraction to retrieve all the missing information.
Unknown values in parent-child dimension
If you're analyzing a parent-child dimension, like Supervisory Hierarchy, and notice an Unknown category, your data may be missing one of the hierarchy nodes. In a parent-child dimension, the records must contain columns indicating what the record rolls up to in the hierarchy, such as an employee rolling up to a manager who rolls up to a director who rolls up to an executive. An unknown value indicates a missing record to roll up to.
To validate unknowns in a parent-child dimension, try the following troubleshooting options:
-
Identify a record that rolls up to the Unknown category. To do this, in a visualization, drill into the Unknown category and note the group bys. The group bys are the records that roll up to a missing hierarchy node. If you can't drill into Unknown, it means that the individuals directly report to Unknown. In this scenario, the next step is to go to the Detailed View visual to identify the people who report to Unknown and then cross-reference that information with your source data.
-
Then, in your source data, find the parent record that the record is supposed to roll up to. The parent record is likely missing from your data in Visier, causing the record to roll up to Unknown. The parent record may be missing in Visier for one of the following reasons:
-
The value in the source file is null.
-
The record doesn't exist in the data file that determines the hierarchy, such as being spelled incorrectly or, if in the Supervisory Hierarchy, the person associated with the record is no longer at the organization.
-
Error message appears or chart doesn't display
If you encounter an error when your chart is loading or your chart doesn't display, try using the developer tools in your browser to investigate.
-
Right click on the page with the error, and select Inspect.
-
In the developer tools panel, click the Network tab.
-
In the list of names, find the tochart request.
-
Click the Response tab. If there is a server error, a RCI code and message will appear.
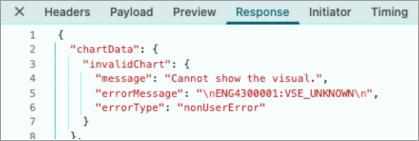
-
Send the RCI code and message to Visier Technical Support for further investigation.
Design objects with no data available
If a design object displays No data available in the objects list in Studio, Visier cannot populate or render the object based on current configurations, mappings, or available source data.
Follow the steps below to investigate why objects, such as analytic objects, properties, metrics, dimensions, and concepts, have no data.
-
In a project, navigate to Data > Model, then select the object type, for example Analytic Objects.
-
In the objects list, find the object displaying No data available.
-
Do one of the following:
-
Select the object, click the More options button
 , and then click View debug info.
 -
In the Data Available column, click the View debug info button
 .
.
-
-
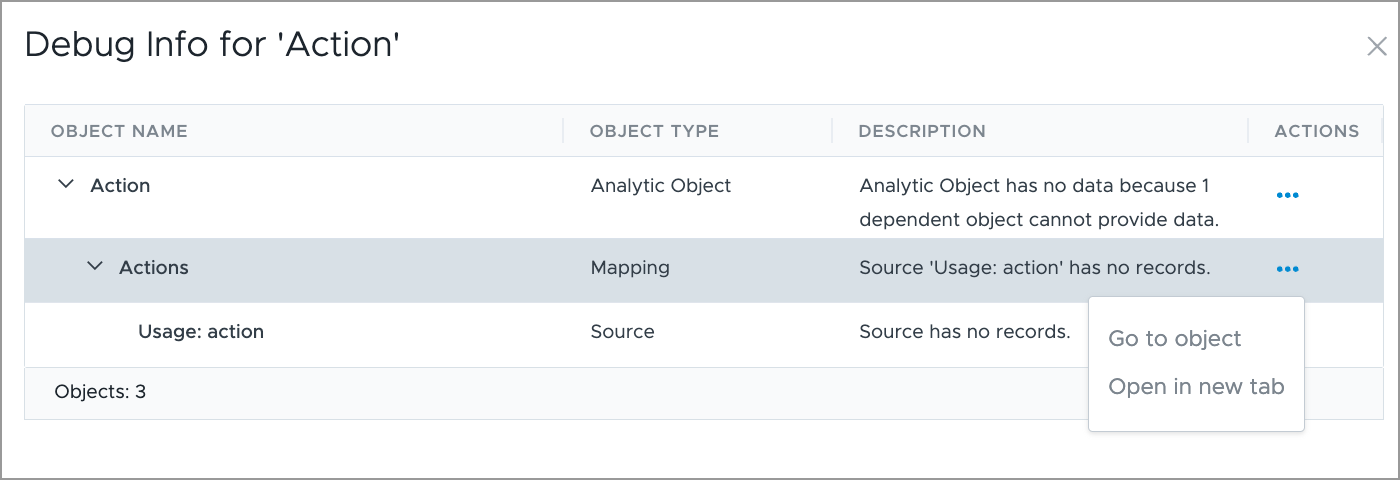
Review the information in the Debug Info dialog, including:
-
Name of the object.
-
Type of object, such as metric, analytic object, source, mapping, and target property.
-
Description of the issue that explains why data cannot be rendered. For example, source has no records, a dependent object cannot provide data, or the object is not associated with a regular mapping.
-
-
In the Debug Info dialog, in the Action column, click the More options button
, and then click Go to object to navigate directly to the object's configuration.