
Create a Calculation Concept
Learn how to create, configure, and customize a calculation concept.
Access requirements
Profiles: Basic Model Developer
Custom profile with these capabilities: Model (Write, Simple)
Reach out to your administrator for access.
Overview
You might decide to create a calculation concept to:
- Create similar metrics whose only difference is the filter. For example, in the Employee Exit Model concept, the metric formulas for Resignation Count, Retirement Count, and Termination Count are the same except for the filterBy statement, which differs by resignation, retirement, or termination. The calculation concept can fill in the filter dynamically using the configured members in the Configure tab.
- Create a calculation hierarchy where many metrics sum up to a parent metric. For example, in the Total Cost of Workforce concept, the metrics Actual Total Direct Compensation and Actual Total Benefits sum up to the parent metric Actual Total Rewards.
When building or modifying a calculation concept, you must first customize the concept hierarchy and perspectives. The hierarchy defines how each concept member rolls up to its parent, such as how Resignation and Retirement roll up to Voluntary Turnover. The perspectives provide different ways to calculate the concept, such as how the Actual and Budgeted perspectives provide different ways to calculate Total Cost of Workforce.
After you set up the hierarchy and perspectives, you can then configure the concept by selecting which dimension members belong to the nodes in each perspective's structure.
Tip:
- To hide sensitive data while keeping metrics visible, map calculation concept nodes to the Unknown member and set attribute access to Aggregate. This prevents data inference without hiding the associated metrics. For more information, see Hide dimension values while keeping metrics visible.
- Watch this video to learn how to configure selection and calculation concepts.
- For a tutorial that walks you through creating a new concept, see Create New Employee Attributes and Metrics.
Create a calculation concept
- Do one of the following:
In a project, on the navigation bar, click Model > Concepts.
In a project, on the navigation bar, click Model > Analytic Objects.
Select an object.
In Attributes, click Create Attribute > Concept.
- Select Calculation, and then click Next.
- Select an analytic object, and then click Next.
-
Type a display name and description.
- Click Create.
Customize a calculation concept
The core components of a calculation concept are:
- Key structure: The primary hierarchy of the calculation concept. This will consist of the top-level calculation and all the child nodes it branches into.
- Perspective: A copy of the hierarchy that can be modified by enabling or disabling nodes. Perspectives allow multiple ways to analyze one calculation concept. For example, the calculation concept Total Cost of Workforce has two perspectives: Actual and Budgeted. These two perspectives allow the user to analyze both what was budgeted for workforce costs and the actual amount spent on the workforce.
To fully customize a calculation concept, do the following:
- Define the parent-child hierarchy. See Create the hierarchy.
- Add and configure perspectives. See Create a perspective.
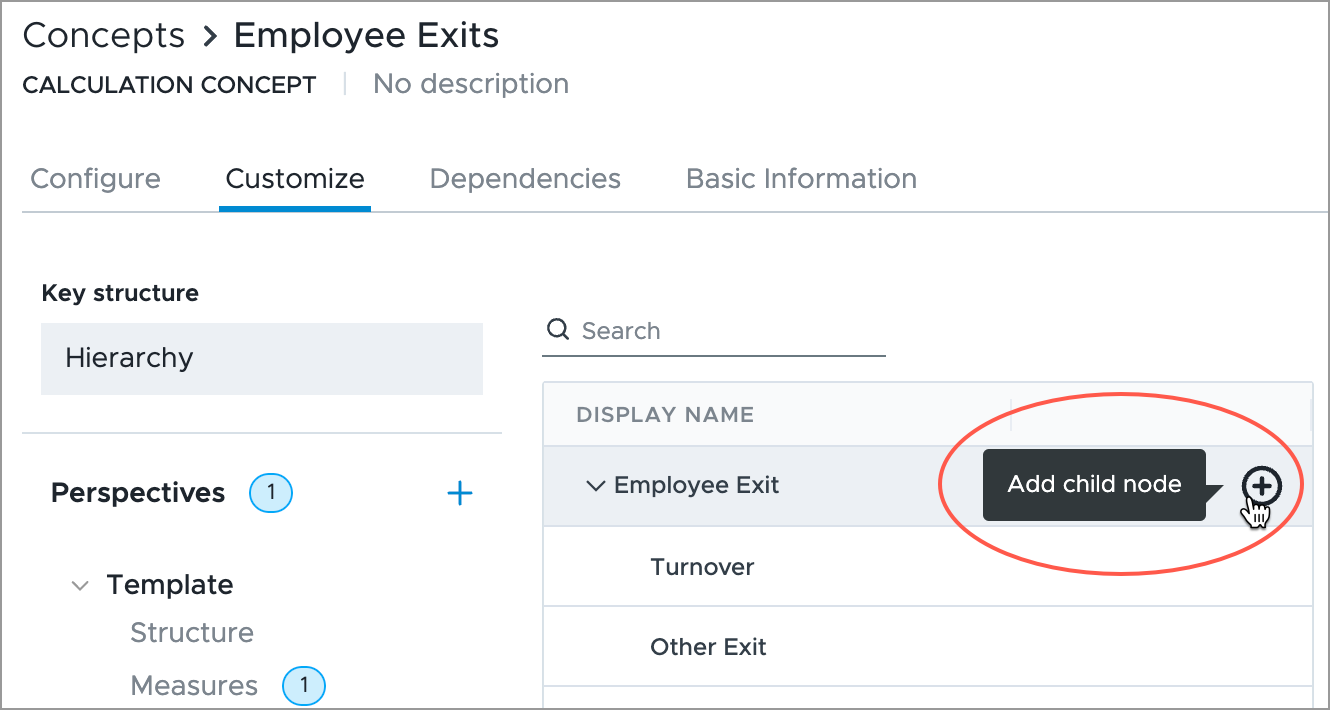
Create the hierarchy
The calculation concept hierarchy consists of parent nodes and child nodes.
Child nodes are the calculations that sum up to the parent member (for example, Parent A = Child B + Child C). Use child nodes to define a top-level metric. Each child node inherits the default template that is defined at the root or top level of the hierarchy and is able to override the inherited template. For more information, see Set the default template.
-
In a project, on the navigation bar, click Model > Concepts.
- Select a calculation concept.
- In the Customize tab, select the key structure Hierarchy.
- Hover over a parent member and click the Add child node button
 .
. -
Type a display name and description.
- Click Create.
- Repeat the above steps for each of the required child nodes in the calculation concept.
Create a perspective
A perspective is a way to analyze the calculation concept.
-
In a project, on the navigation bar, click Model > Concepts.
- Select a calculation concept.
- In the Customize tab under Perspectives, click Create.
-
Type a display name and description.
- Click Create.
Set the default template
A default template is defined at the root or top level node of a perspective and will be inherited by all child nodes in a measure hierarchy or property hierarchy. This includes the dimension, calculation formula, data type, additive type, and other settings. The default template can be overridden. For more information, see Enable or disable nodes.
Select a dimension
-
In a project, on the navigation bar, click Model > Concepts.
- Select a calculation concept.
- In the Customize tab under Perspectives, click Structure.
- Under Dimension, click Select Dimension.
- Select a dimension.
- Click Done.
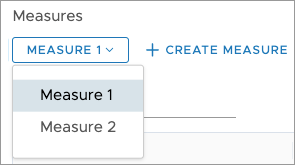
Choose a measure or property
- In the Customize tab, click Measures or Properties in a perspective.
- Click the name of the measure or property to see a full list of measures and properties.
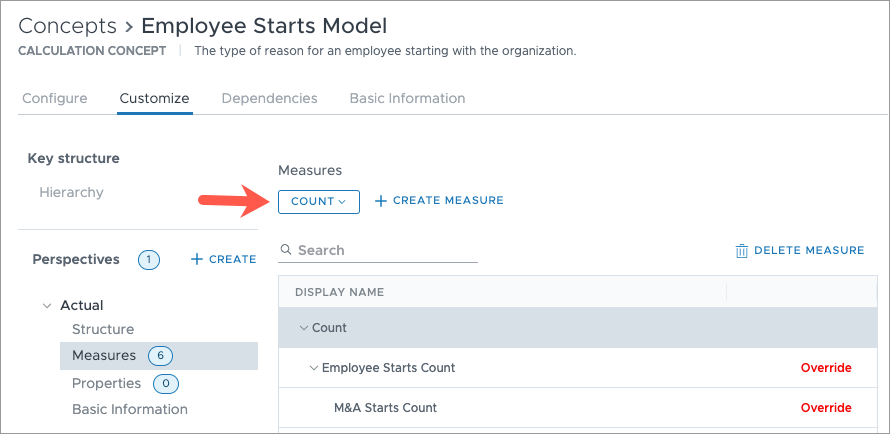
- To view a different measure or property, select one from the list.
Enter a formula
- Click the top-level measure or property in the hierarchy.
- In the Info panel under Calculation, click Edit.
- Type a formula.
- Click Validate.
Modify the settings
- Click the top-level measure or property in the hierarchy.
- In the Info panel, you can do any of the following:
- In a measure, under Measure Settings, select an additive type. This defines if the measure’s hierarchy nodes each add up to the top-level measure.
- In a measure, under Calculation, select an additive type, data type, and toggle the visibility for the selected metric.
- In a property, under Calculation, select a data type. This defines the expected data type of the property.
- Click View More Settings to change any other settings as required.
Enable or disable nodes
The calculation concept hierarchy can be modified within a perspective by enabling and disabling nodes.
The hierarchy of the key structure is replicated in each perspective of the calculation concept. You can customize what is calculated by the calculation concept by enabling or disabling nodes within a perspective. By default, every node in the key structure hierarchy is enabled for a new perspective.
-
In a project, on the navigation bar, click Model > Concepts.
- Select a calculation concept.
- In the Customize tab under Perspectives, click Structure.
- For each node in the hierarchy, enable or disable it by clicking the toggle on the right.
Create a measure
A measure is a collection of metrics that allows analysis to be done on the calculation concept.
-
In a project, on the navigation bar, click Model > Concepts.
- Select a calculation concept.
- Under Perspectives, click Measures>Create Measure.
-
Type a display name and description.
- Click Create.
- In the Info panel of the measure, click Edit and enter a formula.
- Validate the formula.
- Click View More Settings to change other settings as required.
Create a property
A property is a quality of a subject. A property created within a calculation concept perspective is an attribute of the subject associated with the calculation concept. For example, the Total Cost of Workforce calculation concept has the property Actual Direct Compensation, which is then a property of the Employee subject.
-
In a project, on the navigation bar, click Model > Concepts.
- Select a calculation concept.
- Under Perspectives, click Measures>Create Measure.
-
Type a display name and description.
- Click Create.
- In the Info panel of the measure, click Edit and enter a formula.
- Validate the formula.
- Click View More Settings to change other settings as required.
Override the default template
If you want certain child nodes to differ from the default template of the top level hierarchy node, you can make changes in the selected node's Info panel. You can override the default template per perspective or property.
-
In a project, on the navigation bar, click Model > Concepts.
- Select a calculation concept.
-
Navigate to Customize.
- Under Perspectives, click Measures or Properties.
- Select a specific measure or property from the list.
- Select a child node in the list of measures or properties.
- Enable the Override toggle.
- Change the child node from the default template by doing any of the following:
- Under Metric Settings, click Edit to change the formula for calculating the node.
- Click the Visible in Analytics toggle to enable viewing the metric in your solution.
- Select a new value from the Additive type list to change the additivity of the member.
- Select a new value from the Data type list to change the member's data type.
- Click View More Settings to change more settings, such as the analytic object.
Configure a calculation concept
For each perspective, map members to nodes to define a calculation concept.
Note:
- For a tutorial that walks you through configuring concepts, see Configure Concepts After Loading New Data.
To modify a calculation concept, select members for each of the concept's perspectives which will track the various members within your selected population. For example, the Actual perspective in Total Cost of Workforce will have the members Vacation Pay and Sick Pay mapped to the Pay for Time Not Worked node.
To configure a calculation concept:
-
In a project, on the navigation bar, click Model > Concepts.
- Select a calculation concept.
- In the Configure tab, select a perspective to see its nodes.
- Click the node you want to configure.
- Select all the members to include in the node.
- Repeat steps 4 and 5 for all nodes.
Note:
- A member can only be included in one node. We recommend mapping every member to a node.
- To make sure you don't map the same member to multiple groups, turn on Highlight duplicates. This highlights any members that are in more than one group so that you can identify and remove duplicates where necessary.
The following screenshot shows an example of the configuration area for a calculation concept.
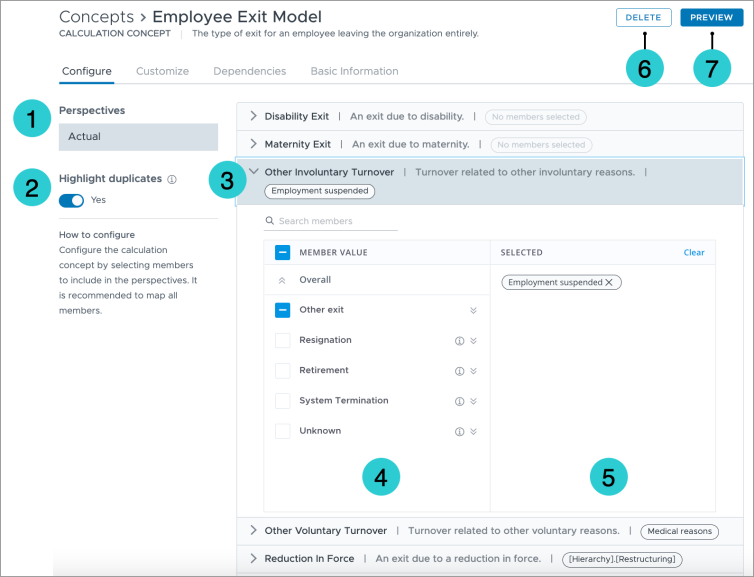
- Perspectives: One or more ways to analyze the calculation concept. In this example, the Actual perspective represents the real employee exits in your organization. Some calculation concepts might have an additional Budgeted perspective to calculate future budgeting exercises.
- Highlight duplicates: A toggle that helps you see which values are included in more than one hierarchy node.
-
Hierarchy node: The members that make up each calculation in the calculation concept. In the above screenshot, the Employee Exit Model’s Actual perspective is calculated using the values in Disability Exit, Maternity Exit, and Other Involuntary Turnover, among others. This list is generated by the hierarchy nodes in a perspective’s Structure area found in the Customize tab.
Note: To customize the hierarchy nodes, contact Visier Technical Support.
- Member values: The values available to use in the calculation concept. Each member value should be mapped to one hierarchy node.
- Selected values: The selected values. These are the values that will be used to calculate the concept in the solution.
- Delete: A button to delete the concept.
- Preview: A button to preview the concept in the solution.
Hide dimension values while keeping metrics visible
In some organizations, certain dimension values are sensitive even if the broader metric is not. For example, a Finance user may need to see that a turnover event occurred without seeing the specific exit reason in Detailed View.
To hide sensitive data while keeping metrics visible, do the following two-part configuration:
Map the unknown member
-
In a project, on the navigation bar, click Model > Concepts.
-
Select a calculation concept, such as Employee Exit Model.
- In the Configure tab, select a node in the hierarchy, for example System Termination.
- Select the Unknown member to map it to the node.
Set aggregate data access
- In a project, on the navigation bar, click Security > Data Access Sets.
- Select the relevant data access set, for example Employee, and click the Data Access column.
-
Locate the sensitive dimension attribute, such as Exit Reason, and set it to Aggregate access.
As a result, the metrics remain accurate and visible while preventing access to individual values in Detailed View. As long as the user has detailed access to other attributes, such as employee name, they can still see relevant records in Detailed View. The restricted dimension column displays Unknown instead of the actual value.
Note: If a user groups a visualization by the restricted dimension and selects a specific member in the chart to View Details, the list will return empty. This prevents users from inferring restricted values from the results.
Automated concept configuration
Prerequisites: Your organization must opt in to AI features. In the global workspace, click Settings > AI Features.
Use Automap to configure concepts based on AI recommendations. With automap, Visier can detect unconfigured values and intelligently suggest configurations. The AI model used in this feature was trained on datasets that may contain historical, societal, and statistical biases and can inadvertently perpetuate these patterns in the output. Please review the outputs carefully. For more details on Visier's AI Bias prevention, see Bias Prevention and Responsible AI.
To configure a concept with automap:
- In a project, on the navigation bar, click Model > Concepts.
- Select a calculation, process, or member selection concept from the list.
- In the Configure tab, click Automap.
Result: Visier determines whether any of the unconfigured values belong to an existing concept member. If so, Visier includes the values appropriately. To see the summary, click View Summary.
- Optional: Review the mapped values and unmap any values if necessary.
Automap can only be used to include values, for selection concepts you must exclude values manually. Automap remembers your mapping preferences. If you've previously mapped or unmapped members manually, automap will respect those choices and won't automatically remap them.
To reset the configuration and apply automap, click the More options button ![]() > Reset configurations.
> Reset configurations.
Note: Automap is available for selection concepts with under 200 members and process/calculation concepts with under 50 members. For calculation concepts, automap will map all of the concept's perspectives.
Validate a concept
Access requirements
Profiles: Basic Model Developer
Custom profile with these capabilities: Model (Read, Simple)
Data required: Access to data you're validating
Reach out to your administrator for access.
Previewing your concept allows you to quickly look at your concept as a visual to determine whether its components are configured correctly. To preview your new concept, its associated analytic object must have a default metric. For more information, see Default metric.
-
In a project, on the navigation bar, click Model > Concepts.
-
Select a concept.
- In the upper-right corner, click Preview.
Note: The visual won't display if the concept was configured incorrectly.
Example: Build a calculation concept from end-to-end
Let's say you want a concept that reclassifies your employee exit reason data into voluntary and involuntary groups and you want the groups to roll up to an overall "exits" group. In Visier, you already have an analytic object called Employee Exit that captures your exit data, including a dimension called Exit Reason that has values like Resignation, Retirement, Reduction in Force, and Termination.
If you think this use case sounds familiar, that's because it's already in Visier! This example walks you through creating, customizing, and configuring the Employee Exit Model calculation concept (but with a new name, just for this example).
Step One: Create the concept
First, you can create a concept. In this example, we'll name it Employee Exits and select the Employee Exit analytic object.
-
In a project, on the navigation bar, click Model > Concepts.
- Click Create Concept.
- Select Calculation and then click Next.
- Search for and select the Employee Exit analytic object and then click Next.
- In Display name, type Employee Exits.
- In Description, type The type of exit for an employee leaving the organization entirely.
- Click Create.
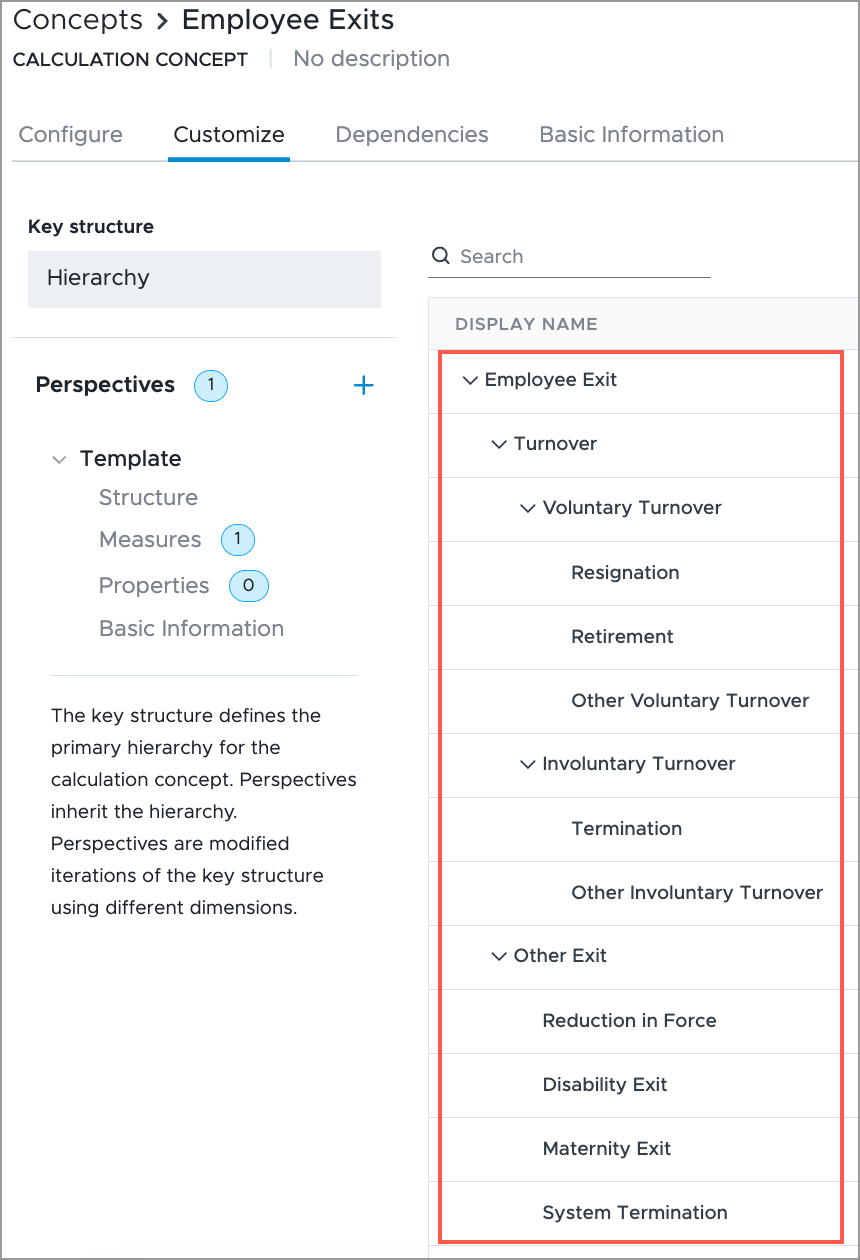
Step Two: Build the hiearchy
Next, in the Customize tab, under Key structure, you can define the concept's hierarchy. By default, Visier creates the top of the hierarchy. In this example, the top level is Employee Exit. Let's say you want to organize exit reasons into two categories: Turnover and Other Exit.
- To add Turnover, hover over the Employee Exit level and click the Add child node button .
-
Type a display name and description.
- Click Done.
- Repeat steps 1 to 3 to add Other Exit.
Let's say that you want to categorize Turnover into two types of turnover: Voluntary and Involuntary.
- To add Voluntary Turnover, hover over the Turnover level and click the Add child node button .
-
Type a display name and description.
- Click Done.
- Repeat steps 1 to 3 to add Involuntary Turnover.
You can categorize Other Exit into the types Reduction in Force, Disability Exit, Maternity Exit, and System Termination. Repeat the previous workflow to add child nodes for each type to Other Exit.
Additionally, you want to categorize Voluntary Turnover into the types Resignation, Retirement, and Other Voluntary Turnover, and Involuntary Turnover into Termination and Other Involuntary Turnover. Repeat the previous workflow to add child nodes for each type to Voluntary Turnover and Involuntary Turnover.
When finished, your calculation concept should look like the following image.
Step Three: Set up the perspective structure
Now that the hierarchy is complete, you can set up the perspective. In this example, you only need one perspective to analyze employee exits.
- In Perspectives, click Structure. You'll see the same hierarchy that you just created.
- In Dimension, click Select.
- In the Select a dimension dialog, click Select Subject and then select Employee Exit.
- In the list of dimensions, select Employee Exit Reason, and then click Select.
If you navigate to the Configure tab, you can now select dimension members from Employee Exit Reason to include in the perspective. However, next, you can finish setting up the perspective.
Step Four: Set up the perspective measures
Let's say that you want this concept to calculate the count and rate for each exit type. For example, you want to be able to see the Resignation Count and Resignation Rate. To easily create these metrics, you can create measures in the concept's perspective.
- In Perspectives, click Measures.
- To delete the default measure, click Delete Measure.
- Click Create Measure.
- Type a display name. In this example, you can type Count.
- Click Create.
Visier populates a metric for each node in the perspective structure. If you want, change the display name for each metric so that it uses your organization's metric naming guidelines. In this example, the metrics have names like Voluntary Turnover Count and Resignation Count.
Next, you can define the metric at the top of the hierarchy. Each metric in the hierarchy inherits its formula and settings.
- In Perspectives, in Measures, select the Count measure.
- Click the metric at the top of the hierarchy. In this example, the metric is Count.
- In the Info panel, scroll down to and click View more settings.
- In Formula, type on Employee_Exit filterBy(calculationMapFilter) aggregate count(Employee_Exit.EmployeeID). This means the metrics counts exits by Employee ID.
- In Settings, set the following:
- In Data type, select Integer. This means the metric value is an integer.
- In Analytic object, select Employee Exit.
- In Additive type, select Additive over time. This means that exit values can be summed across time periods, such as adding the exit counts in January and February.
- The other settings are optional. For more information, see Settings (required).
- In Basic Information, turn on Visible in Analytics. This means that your end users will be able to use the metric after you publish the project to production.
- In Basic Information, note the Object name. You need the object name for the Rate measure formula! In this example, the object name is Template_Count.
- When finished, click the Close button
 to return to the concept.
The Count measure is now ready to use. Next, you can create the Rate measure in the same way.
- In Perspectives, in Measures, click Create Measure.
- Type a display name. In this example, you can type Rate.
- Click Create.
- Click the metric at the top of the hierarchy. In this example, the metric is Rate.
- In the Info panel, scroll down to and click View more settings.
- In Formula, type Employee_Exits.Template_Count.template / employeeCountAverage. In this formula, Employee_Exits is the object name of the calculation concept, Template_Count is the object name of the Count measure, and employeeCountAverage is the object name of the Average Headcount metric. This formula divides the count of employee exits by the average headcount to find the rate of employee exits.
- In Settings, set the following:
- In Data type, select Percent. This means the metric value is a percentage.
- In Analytic object, select Employee Exit.
- In Additive type, select Non-additive. This means that exit rates can't be summed across time periods, concepts, or dimensions. For example, you can't add the exit rate for January (9%) and February (8%) to get a total exit rate of 17%.
- The other settings are optional. For more information, see Settings (required).
- In Basic Information, turn on Visible in Analytics. This means that your end users will be able to use the metric after you publish the project to production.
- When finished, click the Close button to return to the concept.
Step Five: Select the perspective members
You're almost done! The hierarchy and perspective are complete, which means you just need to configure the concept. To configure the Employee Exits concept, you'll select all the Exit Reason values from your data and assign them to the groups you created in the concept hierarchy.
- In the Configure tab, in the Template perspective, do the following:
- In Disability Exit, select the values in your data that represent exits due to disability.
- In Maternity Exit, select the values in your data that represent exits due to maternity.
- In Other Involuntary Turnover, select the values in your data that represent involuntary exits that don't fit into your other involuntary turnover group (Termination).
- In Other Voluntary Turnover, select the values in your data that represent voluntary exits that don't fit into your other voluntary turnover groups (Resignation, Retirement).
- In Reduction in Force, select the values in your data that represent exits due to a reduction in force.
- In Resignation, select the values in your data that represent exits due to employee resignation.
- In Retirement, select the values in your data that represent exits due to retirement.
- In System Termination, select the values in your data that represent termination events generated by Visier (such as an employee profile that doesn't have a termination event but does have an end of data).
- In Termination, select the values in your data that represent exits due to employment termination.
- When finished, click Preview. You can now validate that the calculation concept works as expected. If the visualization has no data, try changing the time period to a time that you know has data.
After making sure it's correct, you're finished! To make the concept available to your users, publish the project to production. For more information, see Publish Project Changes.