Create a Report
Create a report to summarize and present your data in a tabular format.
Access requirements
Permission with these capabilities: Write Report
Reach out to your administrator for access.
Overview
Reports are versioned or non-versioned, depending on where you create the report.
-
Versioned reports: Created in a project and are subject to the project lifecycle, module allocation, and content package access. Publishing a report created in a project makes it available to all users with report access. You can control report
-
Non-versioned reports: Created in the Reports room. By creating a report in the Reports room, that report is only available to you and any users or user groups that you share the report with. Non-versioned reports are useful if you want to expose a report to a select few users or user groups, or even just for yourself.
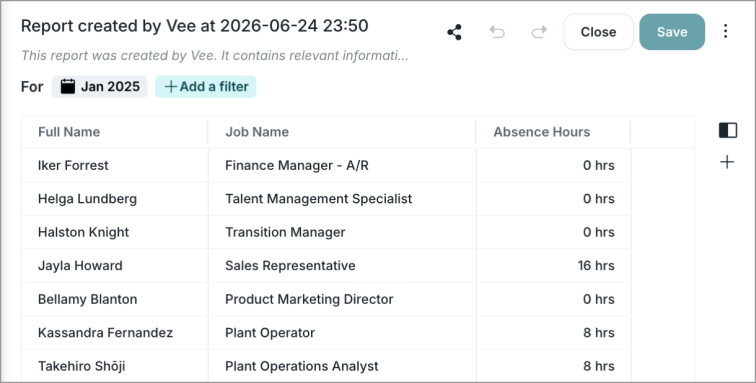
If you are subscribed to Vee, you can also create a report directly from a generated list response. For more information, see Create a report with Vee.
To get started with creating reports, familiarize yourself with the Report Editor. The Report Editor is where you'll build and customize your reports. For more information, see Report Editor.
Tip: You can also duplicate an existing report and use it as a starting point. In the Reports list, hover over the report you want to duplicate and then click the Duplicate button  .
.
Note: This feature is also available through Visier's public APIs. For more information, see Reporting API.
Create a report
- Do one of the following:
- To create a versioned report, open a project and navigate to Model > Reports.
- To create a non-versioned report, open the Solution and, on the navigation bar, click Reports
 .
. - To create a non-versioned report from a generated response in Vee, see Create a report with Vee.
- Click Create Report.
- Add a title and description for your report.
- Optional: Add a URL in the description to reference external resources. For more information, see Add links to a report description.
- In Report settings, do the following:
- Under Report on, select a subject or event.
Choose the table type for your report, select Table or Pivot Table.
- Table: Organize data into columns and group by rows for detailed lists.
Pivot table: Intersect row and column categories to calculate aggregated values like sums or averages.
Note: Table is the default table type. Switching the table type removes all configurations, such as columns, rows, and group by's. It is recommended to decide on your report structure before adding specific attributes.
Configure your report data based on the selected table type by clicking the Add button
 or the input field for each section. To arrange or modify how your data calculates and displays, see Manage fields.
- For tables:
- Add columns to define the column attributes.
- Add group by's to define row attributes.
For pivot tables:
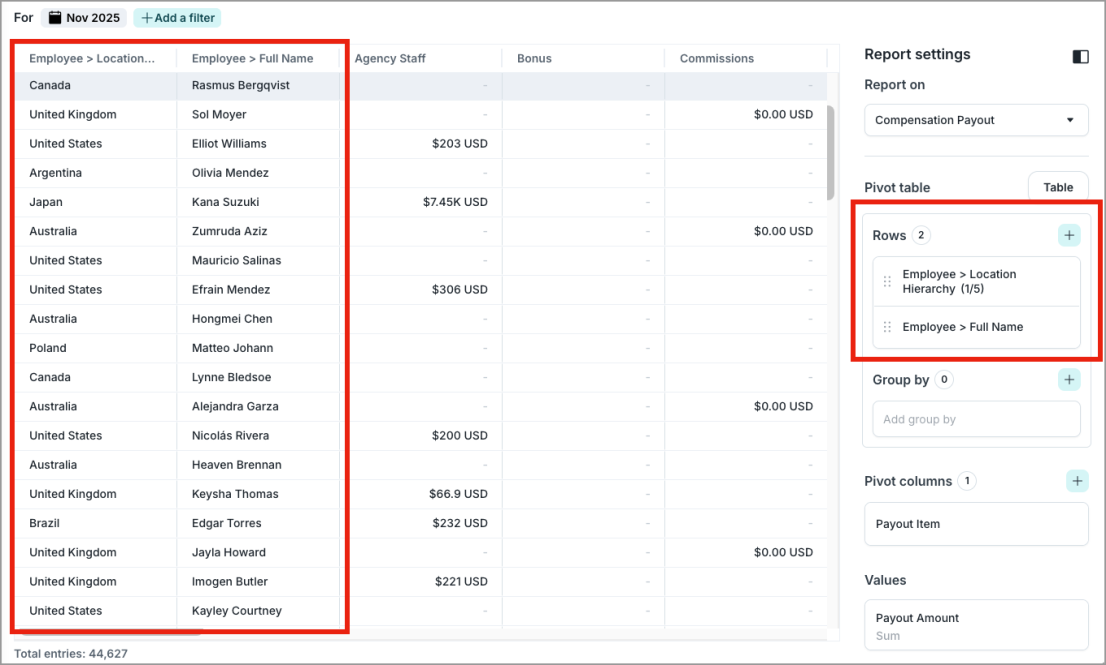
Add rows to define the row attributes. These will display as flat rows.
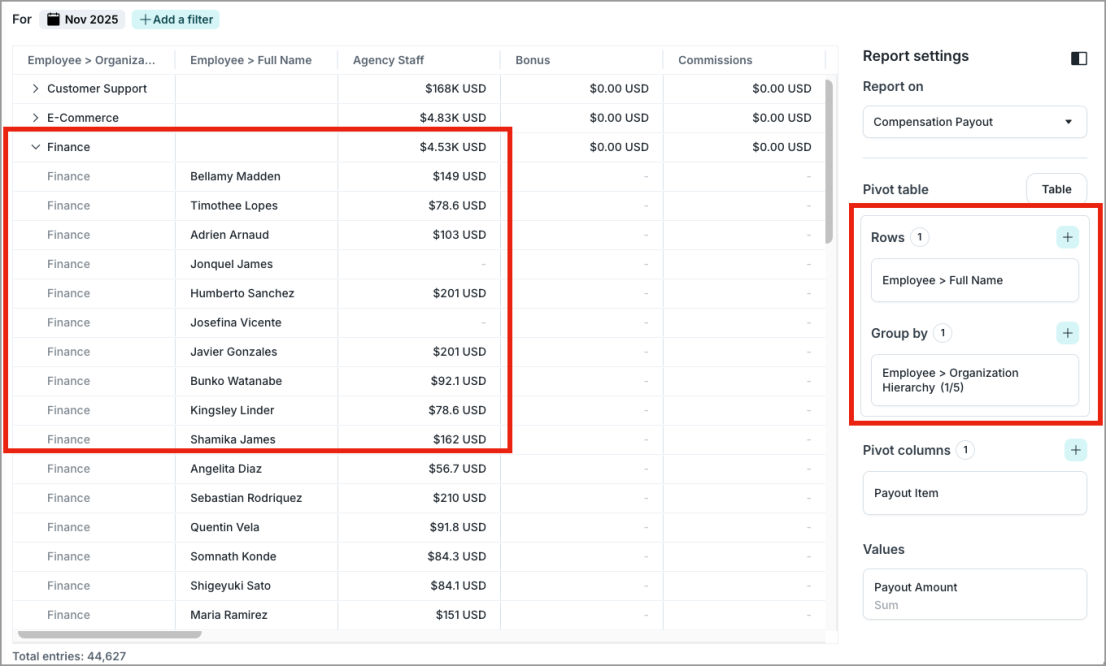
Add group by's to create expandable and collapsible nested groupings within your rows. For more information, see Pivot table layout examples.
Add pivot columns to transform dimension members to column headers, pivoting the data for cross-tabulation.
Add values to calculate aggregated values, such as sum or average, at the intersection of your rows and columns.
- For tables:
Optional: Manage the visibility of data items in your report. Under Display options, adjust the following toggle buttons:
Show zeros: Toggle on to display columns or rows where all values equal 0.
Show N/A values: Toggle on to display columns or rows where all values are null.
Note:
Display toggles only change visibility in the report and report download. They do not filter data out of underlying calculations, such as averages or overall totals. To exclude values from calculation logic entirely, click Add a filter.
If a table contains non-numeric columns, such as Employee Name, or mandatory fields, such as Event Date, turning off Show zeros will not hide the row, as non-numeric columns cannot be zero.
If a column is hidden, a strikethrough appears on the column name in the side panel to indicate it is hidden. This does not apply to pivot tables.
When data is missing in a pivot table group, individual cells display as
-(N/A), while the overall group total displays as 0. Turning off Show zeros will hide the entire group column, even if its underlying items display as-(N/A).
- Click the Time picker to set the granularity, time period, and time window. If you want the report to continuously display the latest data, select the Update automatically to check box and select a time period option.
- Optional: Click Add a filter to apply a filter to the entire report.
- Optional: Edit suggested attributes for the report. For more information, see Edit suggestions.
- When you're finished, click Done editing.
- If creating in a project, do the following:
- Add the report to a content package. For more information, see Content Packages.
- Publish the project to production. For more information, see Publish Project Changes.
- Optional: In the Reports room, click the Share button
 in the Quick Actions menu to share the report with others. You can select the users or user groups to give Viewer access to the report, or generate a link that you can share with other users. You can also access this option when editing the report.
Note:
- The Share button is only available to the report owner. The report must be created in the Reports room (non-versioned).
- Users must also have the Share Analysis capability to share reports with other users.
- The Share button
Add links to a report description
Include a URL in a report's description to link to external resources. When you save the report, the URL becomes an active link in both the report and the Reports list. Clicking a link opens the destination in a new browser tab.
Visier supports http://, https://, and www. destinations. URLs starting with www. automatically convert to https://.
To add a link, use one of the following options:
- Bare link: Type the URL directly as plain text, for example www.visier.com.
-
Hyperlink: Use the
[link label](URL)format, for example [Visier's website](https://www.visier.com).Note: Visier does not support relative URLs or other schemes such as
mailto:orftp://. Malformed or unsafe URLs display as plain text and are not clickable.
Pivot table layout examples
Adding an attribute as a row or a group by changes how flat or nested your data looks when building a pivot table.
Example: Flat layout
When you add attributes as rows, every combination of data gets its own row. If multiple rows share the same detail, such as location, it is repeated on every single line.
Example: Nested layout
When you add attributes as a group by, the data rolls up into a hierarchical tree structure. Users can click to expand or collapse details.
Manage fields
Once you add attributes to your report, use these actions to arrange or modify how your data calculates and displays.
Note: Date data types are displayed in a long format by default, for example Dec 13, 2024. To use numerical formatting, such as 12/13/2024, contact Visier Technical Support to enable this feature.
Layout actions
In the report, click the More options button  next to any column or group by header to adjust its layout.
The available options depend on the type of report, column, and group by:
-
Rename a column or group by: Type a new name and click the Confirm button
 .
. -
Replace an attribute: Click Replace column or Replace group by and select a new attribute from the list.
-
Add an attribute: Click Add column or Add group by and select an attribute from the list.
- Sort data: Click Sort ascending or Sort descending, or click a column or group by header directly to change the order. Hold the Shift key and click to sort multiple.
-
Add a filter to columns: Click Add filter and select the attribute values you want to include or exclude.
- Show count in a group by: Toggle Show count to show the number of records under each group in the report.
-
Delete a column or group by: Click Remove column or Remove group by to delete the field.
You can also rearrange table columns directly by clicking and dragging a column header to your desired position.
Field customization actions
In the side panel, under Report Settings, click the More options button  next to any field to edit its display name or behavior. Options vary based on the report type and field type:
- Columns in a table
Select an aggregation function: Choose how data calculates when you group the data together in rows.
Note: The aggregation functions will only appear in the report if you add a group by. For example, if you select Sum on a column for Actual Pay, then group by Location, each row in the column will show you the sum of actual pay for each location.
- Manage subcolumns: If you added a column for a calculation concept property that has subcolumns, you also have the option to manage the subcolumns that appear in the report. For more information, see Manage subcolumns in a table.
- Group by's in a table or a pivot table:
- Show counts: If you toggle Show count, it will show the number of records under each group in the report.
Manage levels: Select the levels you want to include for the group by. Each level you select will be added as a separate group by column in your report.
- Pivot columns in a pivot table:
- Show overall: If you toggle Show overall, it will show the overall as a column in your report.
- Values in a pivot table:
- Select an aggregation function: Select the calculation method used across your pivot table, such as sum, count, or average.
Manage subcolumns in a table
If you added a column for a calculation concept property that has subcolumns, you have the option to select which subcolumns appear in the table. If you do not select any subcolumns, only the total column will be shown by default.
A calculation concept property is a value derived from hierarchical calculations performed on leveled dimensions. For example, let's say you select Actual Health Benefits, which is a property on the Total Cost of Workforce calculation concept.
Total Cost of Workforce performs calculations on a leveled dimension called Payout Item. A Payout Item is the payroll category that makes up an employee's payout. The Payout Item leveled dimension may have multiple levels that can be selected as subcolumns in the report, depending on your data. You can select a specific level to view all attribute values at that level.
For example, Actual Health Benefits may have the following levels:
- Level 1 (Payout Item): The amount of Actual Health Benefits broken down by payout items in the selected period.
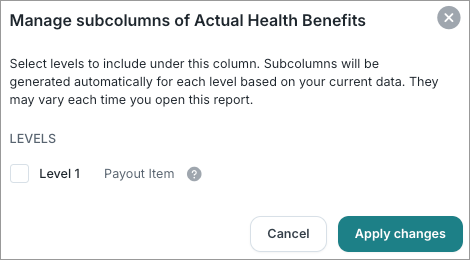
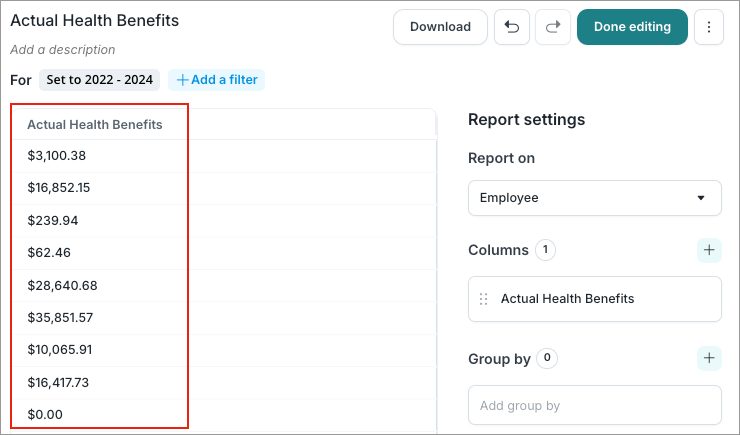
If you do not select any subcolumns, then only the total column will appear by default, as shown in the following screenshot:
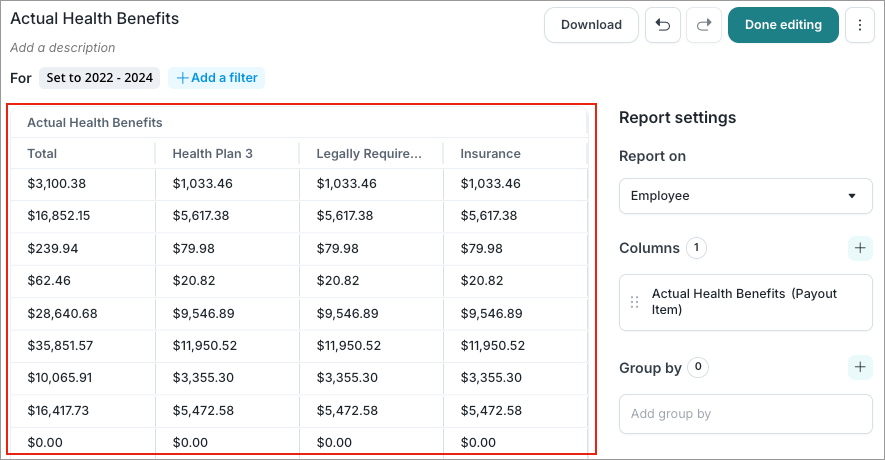
If you select a subcolumn, then all the attribute values at that level will appear nested under the column, as shown in the following screenshot:
To manage subcolumns, do the following:
- In Report settings, under Columns, hover over a column and click the More options button .
- Click Manage subcolumns.
Note: This option only appears for columns with subcolumns available.
- Select the levels to include under the column.
- Click Apply changes.
Edit suggestions
When editing a report, you have the option to select attributes to be used as suggestions for other editors. Suggested items help you surface relevant selections for the report and guide your team on what to include. These suggestions will appear under the Suggested tab and in the columns and group by menus.
To edit suggestions, do one of the following:
-
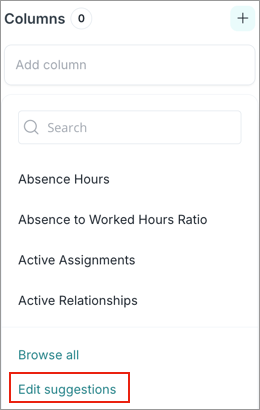
Click Edit suggestions in the picker.
-
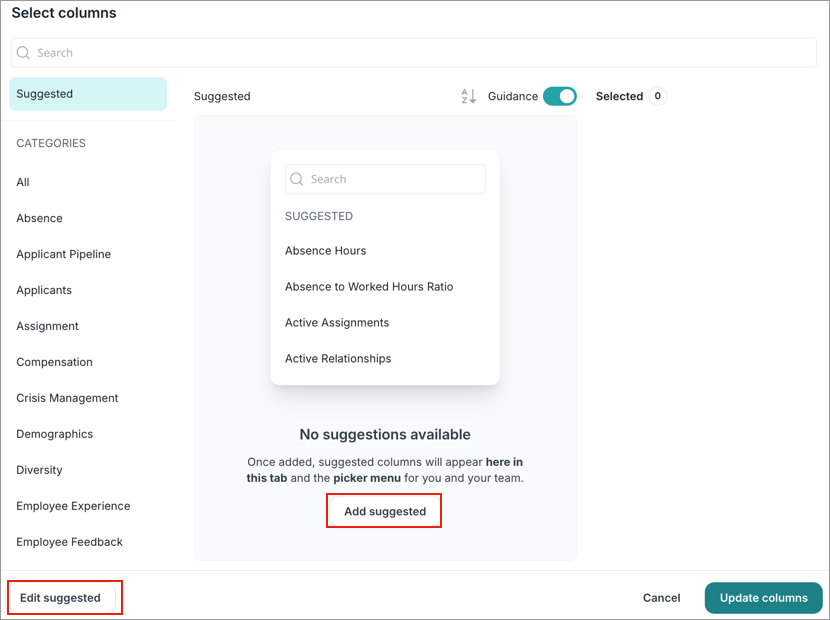
Click Edit suggested or Add suggested in the full screen picker.
Create a report with Vee
Note:
-
To enable this feature, contact Visier Technical Support.
-
Vee 2.0 does not currently support Reports. For more information, see Determine your Vee experience.
When you ask Vee a question and the response is returned as a list, you can create a non-versioned report using the data in the generated response. Use prompts such as:
-
Show me a list of absences that happened in January, including the length.
-
Give me a list of high-potential employees who are at a high risk of exit.
-
Show me a list of software engineers hired in the last six months, along with their office location and manager.
For more information, see Write effective questions.
How to create a report using Vee
-
Click Ask Vee on the navigation bar.
-
Enter a question in plain language that includes a list prompt.
-
In the response, click the Create Report button.
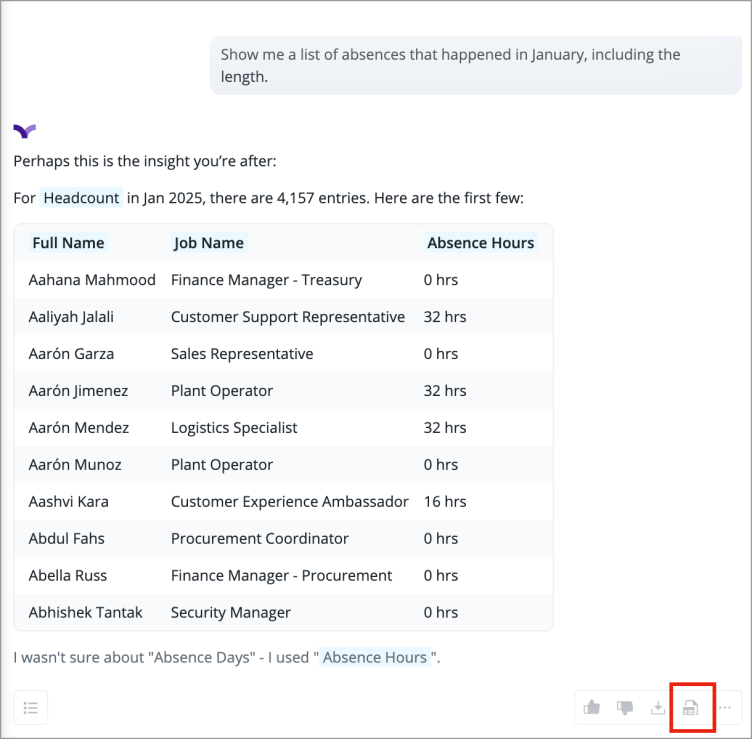
Once created, the report will open in the same window and is automatically saved in the Owned by me tab with the following pre-populated details:
-
Title:
Report created by Vee at YYYY-MM-DD HH:MM -
Description:
This report was created by Vee. It contains relevant information based on your conversation. You can modify it as needed. -
Group by and filters: Applied based on the response. However, the exact sort order may not carry over. For example, if the Vee response is sorted alphabetically by Full Name, the report will open unsorted. You can manually apply sorting in the Report Editor.