
Create a Range Dimension
Learn how to create and configure a range dimension.
Access requirements
Profiles: Basic Model Developer
Custom profile with these capabilities: Model (Write, Simple)
Reach out to your administrator for access.
Overview
Range dimensions are based on properties that have numeric data. To modify the structure of a range dimension, such as its numeric ranges and the property it uses, you can customize a dimension. Customization is done before configuration because it defines the range dimension's schema. After you define the dimension's property and ranges, you can then configure the ranges' display names.
Note: For a tutorial that walks you through creating and modifying a range dimension, see Create New Employee Attributes and Metrics.
Create a range dimension
You can create a dimension in the Dimensions room or by selecting a specific analytic object on which to create the dimension.
Model > Dimensions steps
In this workflow, start by selecting the dimension type to create and then select its associated analytic object.
- In a project, on the navigation bar, click Model > Dimensions.
- Click Create Dimension.
- Selected Range, and then click Next.
- Select an analytic object and then click Next.
This is the object associated with the dimension; for example, if you're creating a dimension for your employees' hair color, the analytic object is Employee.
- Type a display name and description.
- When finished, click Create.
Result: The dimension is created and can now be customized and configured.
Model > Analytic Object steps
In this workflow, start by selecting the analytic object and then select the dimension type to create.
- In a project, on the navigation bar, click Model > Analytic Objects.
- Select an analytic object.
- In the Attributes tab, click Create Attribute > Dimension.
- Select Range, and then click Next.
- Type a display name and description.
- When finished, click Create.
Result: The dimension is created and can now be customized and configured.
Customize a range dimension
Define range groups and modify how they function.
To customize a range dimension:
-
In a project, on the navigation bar, click Model > Dimensions.
- Select a range dimension.
-
Navigate to Customize.
Step One: Select a property
Range dimensions group numeric values from an analytic object's property. To populate a range dimension with data, you must select a property that has data in Visier.
- In Customize, click Edit or Select a Property.
- Select a property from the list.
- Click Select.
Example: Let's say your organization wants a dimension that organizes your employees into age groups. Before you can create a range dimension that groups by age, you first need a property that evaluates each employee's age, such as Age in Months. Then, when you create the Age Range dimension, you can select the Age in Months property to provide data for the dimension.
Step Two: Enable custom ranges
Allow users to create a custom range while conducting ad hoc analysis in your system. The user can create one custom range per attribute to filter the analysis population.
- To allow custom ranges in your solution, turn on Enable custom ranges.
Example: Let's say your Age Range dimension has the ranges 0-25, 25-40, 40-65, and 65+. You realize that these are quite large ranges and you want to allow your users to choose their own ranges when using the Age Range dimension. In the Customize tab, you can turn on Enable custom ranges. Users can then set their own age ranges, such as 20-30 or 60-65.
Step Three: Define your ranges
Set the definition for your range dimension in its treatment of values.
- To allow values below zero, select Include negative values.
- To separate zero as its own range, select Make zero a distinct member.
Step Four: Set a range type
You can decide the type of groups for your range dimension. The ranges can be completely equal for each group or manually defined by the user.
- To use exactly equal ranges, select Equal ranges. You can then set how to subdivide the ranges. For example, you might want to subdivide your age ranges into equal ranges of 20 years starting from 0 up to 60 years.
- To use unequal ranges, select Manually defined ranges. You can then set the range boundaries from lowest to highest. For example, you can set your ranges as 0 20 25 30 35 40 45 50 55 60 65 to create the ranges 0-25, 25-30, 35-40, and so on.
Note: Ranges are inclusive of the lower bound and exclusive of the upper bound. In a range of 0-25, 0 is included in the range and 25 is excluded, meaning the range includes values from 0 up to 24. 25 is then included in the next range, 25-30.
Configure a range dimension
Each numeric range has a display name that you can modify.
To change a range's display name:
-
In a project, on the navigation bar, click Model > Dimensions.
- Select a range dimension.
- In the Configure tab, hover over a range and click the Edit button
 or the range's display name to change it.
 - Enter a new display name.
Example: The Age Ranges dimension is based on the Age in Months property, however, most people think of age in years, not months. As a result, in the Configure tab, we can change the default range display names from 0 ~ 240 to 0 to 20 yrs, 240 ~ 300 to 20 to 25 yrs, and so on.
Troubleshoot "Data is not available"
You may see a "Data is not available" note in the Customize tab. To investigate data availability, check:
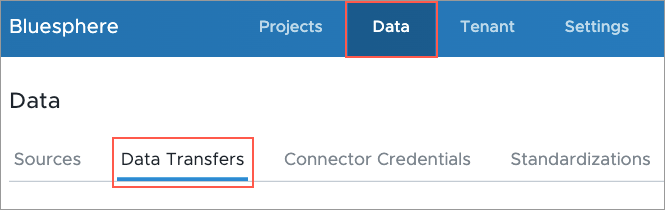
- The Data Transfers room in the global workspace. There must be a data file that contains data for the object.
- The Sources room in the global workspace. The data file containing your object data must be connected to a source. For more information, see Sources.
- The Mappings room in a project. The source that contains your object data must be mapped to the associated property. For more information, see Mappings.
- The data version. After mapping your source data to a property in Visier, you must generate a new data version. For more information, see Data Categories and Run a Job.
Validate a dimension
Access requirements
Profiles: Basic Model Developer
Custom profile with these capabilities: Model (Read, Simple)
Data required: Access to data you're validating
Reach out to your administrator for access.
Previewing your dimension allows you to quickly look at your dimension as a visual to determine whether its components are configured correctly. To preview your new dimension, its associated analytic object must have a default metric. For more information, see Default metric.
-
In a project, on the navigation bar, click Model > Dimensions.
- Select a dimension.
- In the upper-right corner, click Preview.
Publish your changes
When finished configuring and customizing the dimension, publish the project to production. For more information, see Publish Project Changes.
To see your changes, run a data version in production or wait until your next scheduled data load to make the data available to users. For more information, see Data Versions.