

Configure a Mapping
Map source columns to target properties in a mapping.
Access requirements
Profiles: Data Engineer
Custom profile with these capabilities: Data (Write, Detailed)
Reach out to your administrator for access.
Overview
After you create a mapping, you must map source columns to target properties so Visier can extract, transform, and load your data correctly. For more information, see Add a Mapping.
Configure a mapping
Select the mapping
- Do one of the following:
- In a project, on the navigation bar, click Data > Mappings.
- In a project, on the navigation bar, click Model > Analytic Objects. Select an analytic object and then click Mappings.
- In a project, on the navigation bar, click Data > Connectors. Select the Databricks or Snowflake connector, and then click Mappings. To set up a connector, see Sync Databricks Data and Sync Snowflake Data.
- In Data category, select the data category that the mapping belongs to.
- In the left-hand panel, select the mapping.
Map properties
- In the mapping, click Map.
- Optional: In Column melting, click Add and then select the columns to melt by including or excluding them. Column melting converts multiple columns into two columns, one representing the melted column name and another representing the melted column value. For more information, see Column melting.
- Optional: To automatically connect source columns to target properties, click Automap. Choose to automap with or without AI. With AI, mappings are based on the nature of your data; without AI, they’re based on name similarity.
Note: To automap with AI, your organization must also opt in to AI features. In the global workspace, click Settings > AI Features. The AI model used in this feature was trained on datasets that may contain historical, societal, and statistical biases and can inadvertently perpetuate these patterns in the output. Please review the outputs carefully. For more details on Visier's AI Bias prevention, see Bias Prevention and Responsible AI.
- In Properties, expand the property you want to map.
Note:
The EventDate property is required for all mappings, with the exception of static map lookups which have no time axis. For more information, see EventDate.
- To quickly find a specific property, use the Search box.
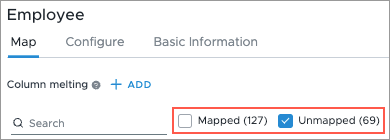
- To filter the list by properties that aren't mapped, de-select Mapped and select Unmapped, as shown next.
- Select one of the following:
- Map from column: Select the data column to associate with the property.
Map from formula: Type a formula to identify the data column to associate with the property and any other details about the property, such as if/else statements. You can optionally click Full Editor to write the formula in full screen, preview the record values, and use the Formula Dictionary.
Note:
- File sources use the Visier Extraction language in Map from formula. For more information about the syntax, see Visier Extraction Language (VEL).
- Table sources use SQL in Map from formula. For more information about syntax, see Use SQL with Table Sources.
- To connect a property to a lookup mapping, click the Connect property to lookup button . For more information about connecting a property to a lookup, see Create a Lookup Mapping.

- To check which business rules use a property, click the View business rules button .

The dialog shows the existing business rules that use the property in the context of any other business rules for the subject. For example, if the Employee subject uses the EmployeeID property in one business rule, the dialog shows all other Employee business rules to help you understand the context of the EmployeeID business rule.
You can go to the business rule in the same tab or open the business rule in a new tab .
- In Intermediate Properties, add any required intermediate properties. Intermediate properties allow you to use business rules to load source data for properties that aren't in Visier's analytic model. They are created only for the data load process, either for load targets in target mappings or on a per-mapping basis in lookup mappings. Because they are temporary, they do not persist after the data load is complete. In lookup mappings, you can create intermediate properties for any column in the source data and then use business rules to map those columns to analytic model properties. For example, you can create an intermediate property from the Employee A mapping, which produces an intermediate property for Employee. That same intermediate property can then be reused across other mappings targeting Employee.
Review settings and validate the mapping
-
In the mapping, click Configure. Review the mapping settings, such as data category, mapping type, target, data file type, override behavior, and target group to ensure the correct settings are applied. Make adjustments as needed. For more information, see Mapping Settings.
Note: Changing the mapping settings may add or remove properties in the mapping.
-
Next, validate the mapping. To preview the included or excluded values in the property, click Preview. For more information, see Preview Mapping Records.
- When finished, run a job to generate a data version in the project. You can then preview your changes in the solution. For more information, see Run a Job.
Column melting
Column melting is a way to combine, or melt, multiple source columns into the same analytic object property. This is done by pivoting vertical columns into horizontal records in a single mapping. This is useful when you have data in a wide format and want to map it into something that expects data in a tall format. Column melting is applied to columns with string values such as pay types like Bonus and Salary, or amount-related values like Currency. This converts multiple columns into two columns, one containing the column names and another containing the column values. This operation can be performed on new or existing columns in your project. Begin by selecting columns to melt:
- In a project click Data > Mappings.
- Select a mapping.
- Next to Column melting, click Add.
- Select columns to be melted.
- Include: Combines all selected columns into two melted columns.
- Exclude: Combines all non-selected columns into two melted columns.
- Click Done.
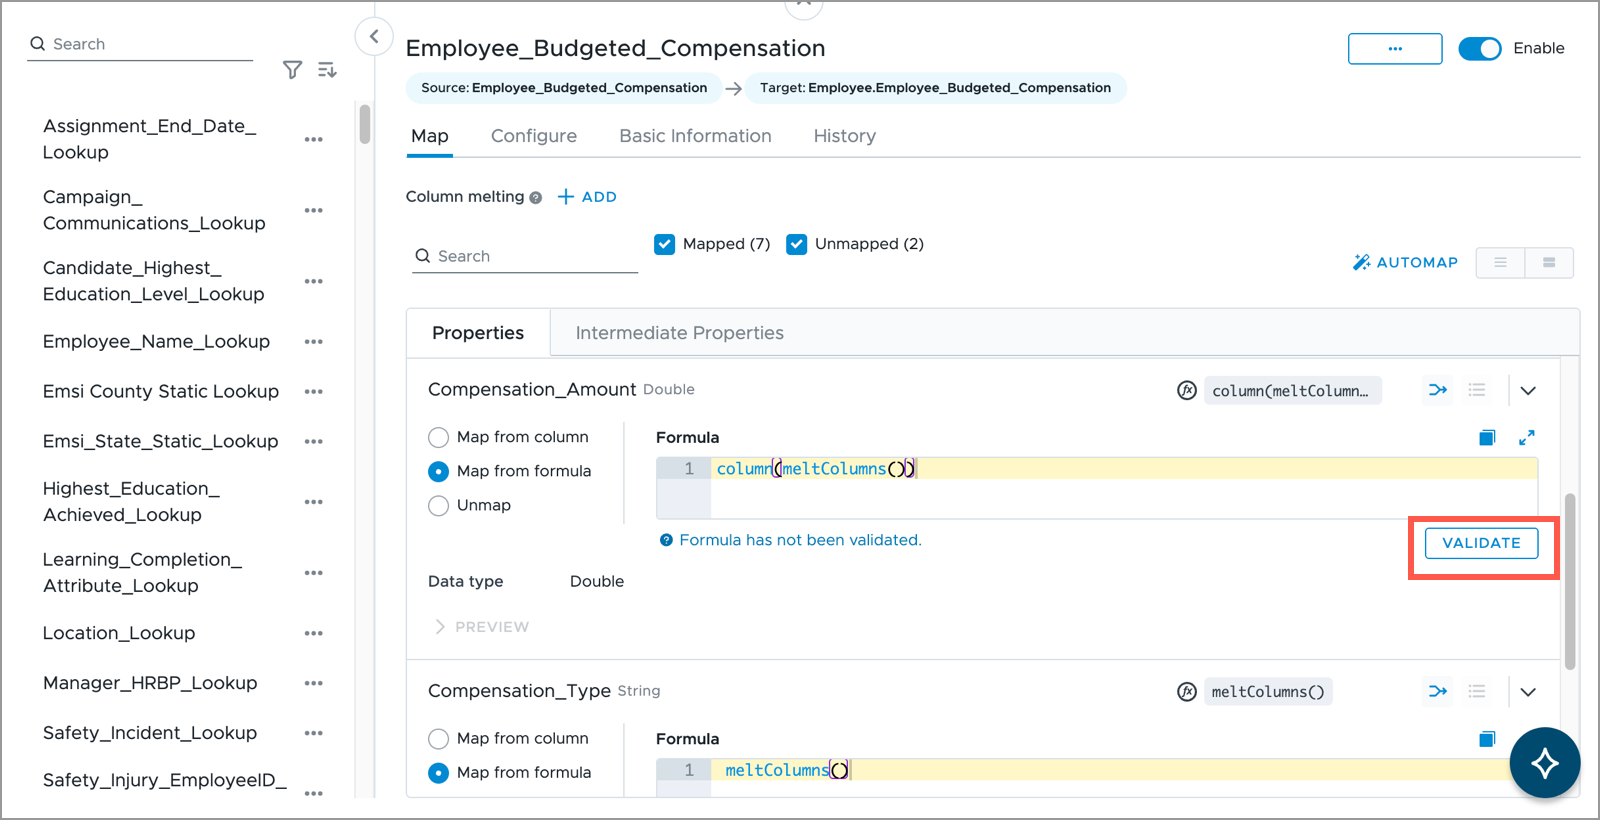
Next, you must map all selected columns using a formula. Different data types require different formulas, so the formula used for amount values will be different from the formula used for string values. To map your column using a formula:
- Click the column containing the amount values to be melted.
- Select Map from formula.
- Enter column(meltColumns()) into the formula field.
- Click Validate.
- Click the column containing the string values to be melted.
- Select Map from formula.
- Enter meltColumns() into the formula field.
- Click Validate.
- After all property formulas have been validated, click Create Mapping.
Your data has now been converted from a wide format to a tall format. The example below uses compensation data to show how data is displayed after column melting. The Salary, Bonus, and Allowance columns in the original data are melted into the meltColumns() column. The values for the Salary, Bonus, and Allowance columns are melted into the column(meltColumns()) column.
How the data is represented in the original wide format:
|
Snapshot Date |
Employee ID |
Salary |
Bonus |
Allowance |
Currency |
|---|---|---|---|---|---|
|
2021-09-30 |
E1234 |
100,000 |
10,000 |
5,000 |
USD |
|
2021-10-31 |
E1234 |
100,000 |
10,000 |
5,000 |
USD |
How the data is represented after being melted to a tall format:
|
Snapshot Date |
Employee ID |
meltColumns() |
column(meltColumns()) |
Currency |
|---|---|---|---|---|
|
2021-09-30 |
E1234 |
Salary |
100,000 |
USD |
|
2021-09-30 |
E1234 |
Bonus |
10,000 |
USD |
|
2021-09-30 |
E1234 |
Allowance |
5,000 |
USD |
|
2021-10-31 |
E1234 |
Salary |
100,000 |
USD |
|
2021-10-31 |
E1234 |
Bonus |
10,000 |
USD |
|
2021-10-31 |
E1234 |
Allowance |
5,000 |
USD |
EventDate
The EventDate property represents the effective date of change, such as:
- Profile change event: An update to an attribute, such as a name change or department move.
- Regular event: A specific point-in-time occurrence, for example, a Compensation_Payout.
Because the platform processes data chronologically, an EventDate is required for all mappings, with the exception of static map lookups which have no time axis. For more information, see Static mapping.
For more information about how Visier processes source data, see Data Processing.