
Explore AI Insight Analyses
Use Visier AI to generate dynamic analyses about your organization, such as risk of resignation and recent turnover.
Overview
Visier harnesses the power of machine learning and AI to enable dynamic storytelling.
AI insights are different from other analyses because they use behind-the-scenes algorithms that provide you with relevant data according to the individual and analysis you’re viewing. For example, “AI Insights into Recent Turnover” uses an algorithm to show you other employees who might also be at risk of leaving due to their similarities with the individual who exited the organization.
The following list describes the actions you can take with AI insight analyses:
- To deliver timely AI insights to your people leaders and HRBPs, set up email scheduling for dynamic templates. See Set up an email push schedule for a dynamic template.
- To view AI insights at any time, Visier provides pre-built dynamic templates. For more information, see Access an ad-hoc AI insight analysis.
- To author your own dynamic templates, see Create a Dynamic Template.
Understanding insight analyses
To interpret an AI insight analysis, the following terminology is important:
- Trigger population: The individual or individuals that triggered the dynamic analysis to generate, such as an employee in your team who exited the organization.
- Scope population: The individuals that are relevant to you. For example, a manager’s scope population is the employees that directly report to the manager.
An AI insight analysis is generated by a trigger population. In ad-hoc exploration, this means that the subject member (that is, a specific individual) you select in the Detailed View visual is the trigger population. Within the generated analysis, some visualizations may use the scope population, which are all the members relevant to you as the analysis viewer. If you’re a manager, the scope population is your team.
The trigger population and scope population apply to the entire AI analysis. That is, the trigger population and scope population are static and do not change after an AI insight analysis is generated.
In addition to the above populations, some visualizations in AI insight analyses may refer to other populations, such as a related population or focus population. If used in a dynamic visualization, these populations are defined independently. That is, Visier’s algorithms calculate these populations based on factors that are defined by the analysis author.
The following definitions may aid you in understanding the purpose of related and focus populations:
- Related population: The individuals who are similar to the trigger population, such as team members whose time since promotion is close in value to the trigger population’s.
- Focus population: The individuals that display in a dynamic visualization. For example, the focus population for regrettable employee exits could be the trigger population and individuals in the scope population that exited in the previous three months.
Example: The populations involved in an AI insight into recent turnover
Let’s say that you’re a Product Marketing manager who manages a team of 10. Your employee Jonah just left the company and you want to understand other members on your team who may be at risk of leaving.
To investigate, you open the AI Insights into Recent Turnover that is generated due to Jonah’s exit. Visier’s AI identifies four employees on your team who are similar to Jonah and may be at risk of leaving.
In this example, there are three populations:
- Trigger population: Jonah left the organization and triggered the AI insight analysis.
- Scope population: The Product Marketing team that you manage is the scope of your AI insight analysis.
- Focus population: Amy, Garrett, Dina, and Mateo are similar to Jonah due to significant property values such as tenure, time since promotion, and job name.
The following image illustrates your Product Marketing team and the members relevant to a recent turnover analysis.
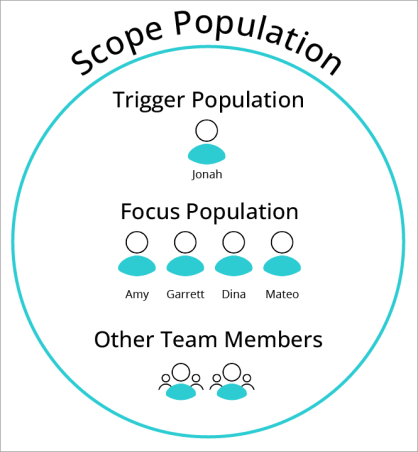
The above image shows your team and the individuals you can expect to see in the recent turnover analysis. The trigger population, Jonah, left the organization. The focus population, Amy, Garrett, Dina, and Mateo, may be at risk of leaving. They are the focus population because Visier’s AI algorithms identified them as similar to Jonah in properties that may have contributed to Jonah’s exit. Other team members may appear in the analysis’s comparisons to aid in turnover analysis.
Set up an email push schedule for a dynamic template
Access requirements
Permission with these capabilities: Schedule Analysis, Share Analysis, and Visier AI Insights
Reach out to your administrator for access.
Dynamic templates generate AI insight analyses. The template is the mold from which user-specific analyses are generated. You can set trigger conditions that will cause an insight analysis to deliver to email recipients, if applicable.
Note: Dynamic analyses shared through email push expire after one year. To keep a permanent copy of the dynamic analysis you receive through email push, you can make a copy. For more information, see Copy an Analysis.
- Follow steps 1 to 4 in Create an Email Push Schedule.
- If a trigger population is required, do the following:
- Add a trigger filter. AI insight analysis emails that require trigger populations will only be sent if the trigger conditions are met. For example, you might use "Has Exit in Period" as the trigger filter. The email recipients will only receive the AI insight analysis if someone in their scope population exited during the period.
If the delivery schedule is Deliver now, set the trigger date range. This is the time period that the trigger is valid. For example, if there was an exit during the trigger date range, the AI insight analysis will be sent to the appropriate recipients.
Note: If the delivery schedule is not recurrent, it will only deliver once. If the delivery schedule is recurrent, the trigger date range is the time since the last successful delivery to the end of the available data. If there is no last successful delivery, an estimate based on the delivery schedule is used instead.
- Optional: If a trigger population is required, you can add a scope filter. Scope filters allow you to change the scope population used in the analysis. If left blank, the scope population will be all the individuals that the user has access to.
- Follow steps 6 to 8 in Create an Email Push Schedule.
Example: An AI insight triggered by employee exit
Let’s say that you configured AI Insights into Recent Turnover to deliver to line managers if any of their direct reports exited the organization in the last quarter.
To do this, you configured the following email schedule settings:
- Schedule name: AI Insights into Recent Turnover (Quarterly)
- Delivery: Deliver now
- Trigger filter: Has Exit in Period
- Trigger date range: February 1 2021 to April 30 2021
- Scope filter: Not set
- Email details:
- Subject line: Quarterly Turnover Analysis Powered by Visier AI
- Message: Hi [RECIPIENT], open this analysis to view important information about recent exits in your department.
- Reply-to email: analyst@company.com
- Recipients: managers@company.com
After saving the email schedule, managers in your organization receive the AI insight analysis with data relevant to their own teams. Let’s say that 15 employees exited during the period, with four of those being on the Development team. The Development manager would receive the “Quarterly Turnover Analysis Powered by Visier AI” email with information about the populations relevant to them, as shown next.
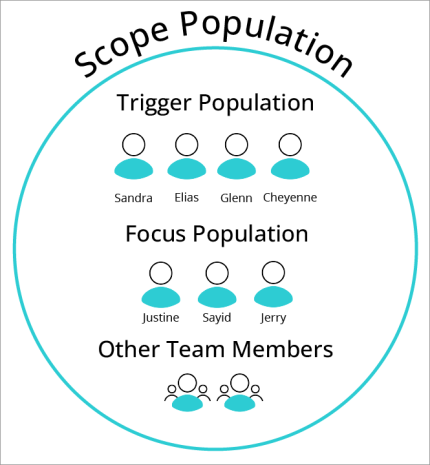
The scope population is the entire Development team. The trigger population is the four employees who exited during the period: Sandra, Elias, Glenn, and Cheyenne. The focus population includes individuals who may be at risk of leaving: Justine, Sayid, and Jerry. Other team members may appear in the analysis’s comparisons to aid in turnover analysis.
Access an ad-hoc AI insight analysis
Access requirements
Permission with these capabilities: Ad Hoc Analysis, View Details, and Visier AI Insights
Reach out to your administrator for access.
To generate an AI insight analysis at any time, you can select an individual employee from Detailed View to access AI-powered insights about that individual. The generated analysis uses information about the employee to show you important information that may be of interest to you based on the selected AI analysis.
Prerequisites:
- You must have detailed access to a set of individuals, for example, as a manager or HR Business Partner.
- Visier-provided dynamic analyses require Visier Talent Essentials and loaded data.
Note: If the required data isn’t loaded, the dynamic analyses may not work as expected.
In the solution experience, do the following:
- On the navigation bar, click Explore.
- Optional: Set the context such as a specific time period.
-
Select the team that reports to you. For example, if you’re a Sales manager, select the Sales team.
Tip: To find your team, change the visual to Breakdown of Headcount by Organization. This allows you to see the organizations in the company that you can access.
- In the Insights tab of the Info panel, click the View Details button
 .
. - Select a subject member. The person that you select will trigger the dynamic analysis. This means that the analysis will generate based on information about the selected individual.
- In the Insights tab of the Info panel, under Try Next, select an analysis that begins with “AI Insights”.
Result: A dynamic analysis is generated based on the context and selected individual.
Doing an employee deep dive using AI insights
You can follow along with the following example to gain insights about your team using the Visier-provided analyses "AI Insights for an Employee 360". In the example, replace the Sales team with the team that you manage.
Let’s say that you’re a Sales manager and you want to view a deep dive analysis about your direct report named Aaliya. The populations relevant to an Employee 360 about Aaliya are shown next.
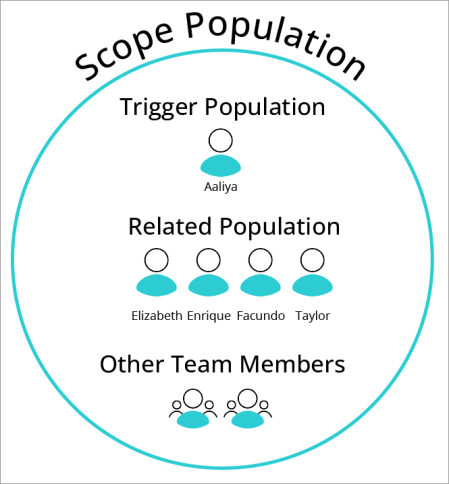
The scope population is the entire Sales team. This includes Aaliya, her related population, and the other members of the team. Aaliya is the trigger population because she was selected in Detailed View before opening the AI insight analysis. The related population are those individuals that Visier’s algorithm determined are similar to Aaliya based on significant properties like location. The other team members are used in comparisons to the overall scope population.
In the Explore room, look at a Breakdown of Headcount by Organization Hierarchy.
First, you can set the context. In the example below, the time period is the first quarter of 2021. Then, select the Sales group.
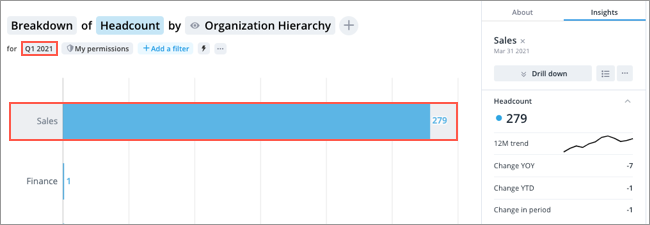
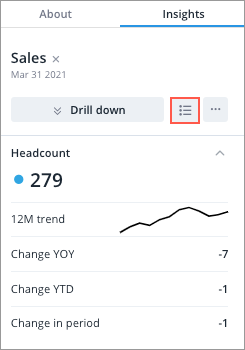
Next, in the Insights tab of the Info panel, click the View Details button ![]() .
.
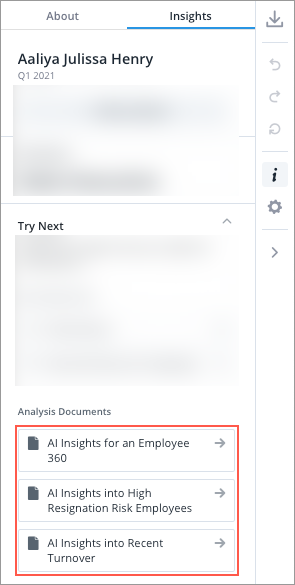
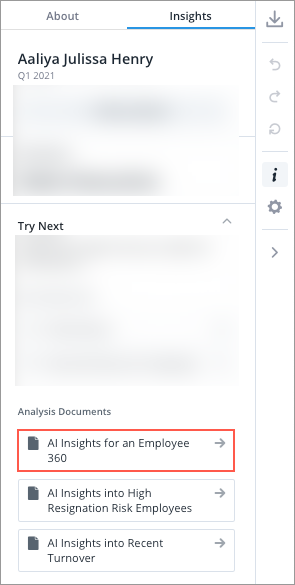
Select a subject member from the list. In this example, we’re selecting Aaliya Julissa Henry. Aaliya is therefore the trigger population that generates the dynamic analysis.
In the Insights tab of the Info panel, under Try Next, select AI Insights for an Employee 360.
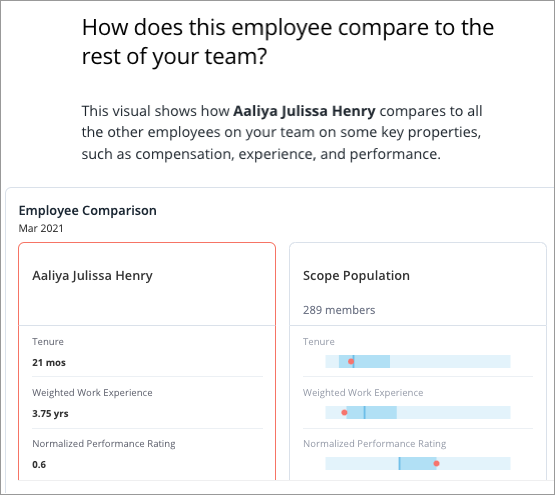
The resulting analysis is generated based on information about Aaliya. For example, the analysis shows details about Aaliya’s tenure, location, time since promotion, performance, and how Aaliya compares against the scope population (other individuals on your team), as shown next.
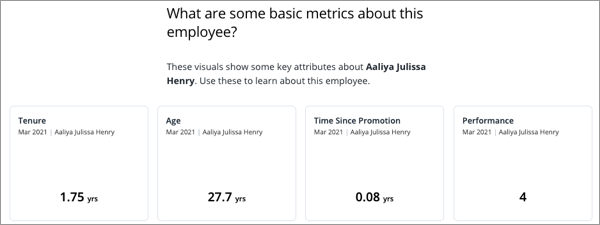
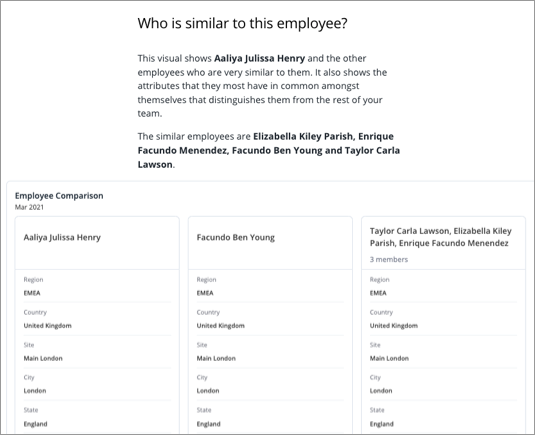
Additionally, the Employee 360 analysis provides an employee comparison that displays other employees that are similar to Aaliya, including Elizabeth, Enrique, Facundo, and Taylor. These four individuals are the related population because they share significant properties with Aaliya such as location.
Frequently asked questions
Why can’t I see any AI insight analyses in the Analyses room?
AI insight analyses can be found within topics in the guidebook. If you’re not sure where to look, try searching for the analysis by name. For example, if you want to find the Employee 360 AI insight analysis, click the Search button ![]() and then type "AI Insights for an Employee 360".
and then type "AI Insights for an Employee 360".
If you can’t see any AI insight analyses, you may not have the correct capabilities and content package access to view an AI insight analysis. For more information, see Capabilities List and Content Packages. The required capability is Visier AI Insights. The required content package is unique to your solution.
How do I edit existing templates?
You can duplicate an existing template and edit it in a project. For more information, see “Duplicate a Visier analysis” in Edit Visier Content. After you finish editing, you can make the new template available to users by publishing the project to production. For more information, see Publish Project Changes.
Why don’t I see Try Next in the Detailed View visual?
You may not have the correct capabilities and content package access to view an AI insight analysis. For more information, see Capabilities List and Content Packages. The required capabilities are Ad Hoc Analysis, View Details, and Visier AI Insights. The required content package is unique to your solution.
If your capabilities and content packages are assigned correctly, it may be an issue with the Detailed View visual. Make sure that Detailed View is showing Employee, rather than a different subject like Applicant.
If the above solutions don’t work, there may be additional validation criteria for the analysis that isn’t valid with the selected context or member. Try selecting other employees in the Detailed View visual.
Why don’t I see a visualization or section after opening an insight analysis?
If the insight produces an invalid visualization or the calculations failed for any reason, content may be dropped from the analysis. For more information about dropped content in an insight analysis, you can click the Show debug information button ![]() .
.
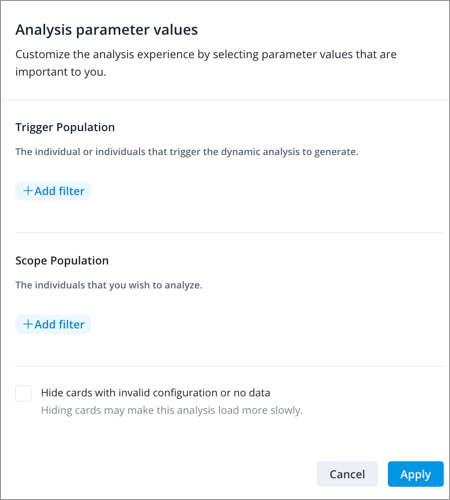
How do I hide visualizations with invalid configuration or no data from the insight analysis?
To hide visualizations with the No chart items to display message, click Parameters. In the Analysis parameter values dialog, select Hide cards with invalid configuration or no data, and then click Apply.
Why didn't anyone receive an email?
AI insights are generated relevant to a user’s access to Visier. This means that you cannot send an AI insight to an external user, that is, someone without a Visier user.
If the recipient is a Visier user, make sure that the recipient has an Employee ID set on their user and they have detailed access to a population in Visier. For example, the recipient could be a manager or HR Business Partner because those individuals have detailed access to employee populations, such as direct reports or entire departments.
It’s possible that the trigger filter and date range did not return any valid populations, so the email did not send. You can check the email push schedule summary to determine if this was the case. For more information, see Manage Email Push Schedules in the Analyses Room.
Why does it take so long to preview an AI analysis or generate one from Detailed View?
AI insights are intensive operations that take time to load. Insights generate using population size and population properties; more members in the population and more properties to consider will cause a longer load time.
If the preview or analysis generation is taking too long, try using a smaller scope population or removing properties from the population configuration for the analytic object. Population configuration is found in a project in Model > Analytic Objects > Population.
Even with a smaller population or fewer properties to consider, insight analyses may take 30 seconds to one minute to process.