
Data Validation and Troubleshooting
Understand how to validate or troubleshoot your data, including the issues that may appear when new data is added to the solution.
Overview
Validation is crucial to confirming the correctness of the data being transmitted to Visier and the transformations within Visier to provide insight. For example, if you upload updated employee data, validate the updates in Visier after the upload to ensure the changes are as intended.
You can validate your data proactively, such as immediately after loading new data or updating metric formulas. In other scenarios, you might validate your data reactively, such as after noticing incorrect metric values or missing data in an analysis. In this article, you'll learn about the validation tools in Visier and techniques for specific troubleshooting scenarios.
Note: Data version, source, and mapping validation is only available if you have the Data Engineer profile.
Validation notification
To receive notifications about failed data versions or unexpected data, use the following options in Visier.
Mailing list
If there's something wrong with a new data version, users on the mailing list receive an email about the data version. Users receive an email in the following scenarios:
- Visier receives a file that fails file validation.
- A scheduled data load attempts to process but files are missing.
- The data load is not successful for any other reason.
Administrators can specify who should receive data version emails in the mailing list. To add or remove individuals from the email notification list, open Studio and click Settings > Mailing List on the global navigation bar. For more information, see Manage the Mailing List.
Alerts and issues
Note: To enable this feature, contact Visier Technical Support.
To help with validation, administrators can define alerts for new data versions—the data in the solution—that check the data correctness of subject members and metrics.
An alert may be critical or non-critical. You as an administrator can choose the notifications you want to send and whether a data version should fail when an alert occurs. For more information, see Data Alerts Settings. A failed data version isn't released to production unless an administrator makes it visible. For more information, see Make a Failed Data Version Visible. Using alerts to fail a data version allows you to investigate major data concerns in the data version and prevent bad data from releasing to production. If a non-critical alert is triggered, issues are generated in the data version and the recipients listed in the alerts settings are notified.
For more information, see Data Alerts and Data Issues.
Metric validation
Use the following tools to validate metrics in Visier.
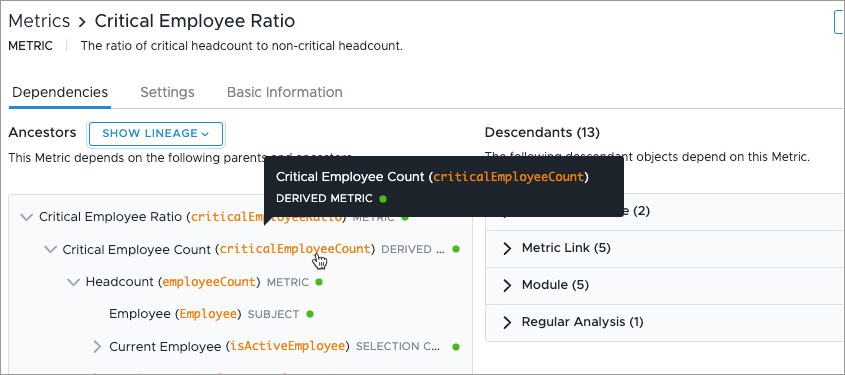
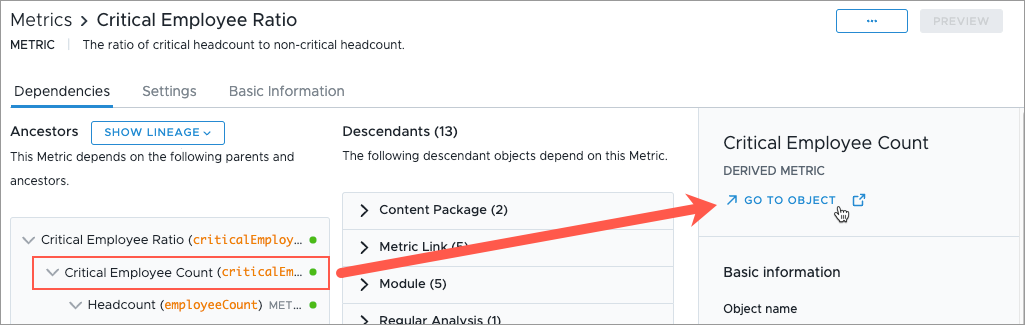
Metric lineage
If you run into an unexpected value while analyzing metrics, use the metric lineage tool to validate the data that is used in the context of the visualization. You can inspect the metric to understand how the value is calculated. For more information, see Validate Metric Values Using Metric Lineage.
Validation analyses
Visier provides out-of-the-box validation analyses to help you confirm that your data is correct in Visier. After loading data, you can preview the solution and explore any analysis with "Validation" in the title to validate your data. For more information about analyses, see Analyses. For more information about how to find validation analyses using the search panel, see Search.
Source validation
Use the following tools to validate your data files and sources in Visier.
Source query
Retrieve specific records from your sources to validate the data in Visier, such as finding duplicate records or finding which files contain a specific record. For more information, see Query Source Data.
Mappings preview
Preview the result of the mappings from your source data to objects in Visier. For more information, see Preview records in a mapping.
File validation
Note: Users must have access to all data, such as the Super Admin permission . Full data access is crucial for efficient and accurate validation. To identify where the transformation has gone wrong, you must have visibility to all events passing through the system.
You can investigate file issues with the following tools:
- In the global workspace, in Data > Data Transfers, you can review each uploaded file and, if there are issues with a file, download the file with validation details to see the issues for each row.
- In a project, in Validation > Debugging > File Validation, you can review the severity of each file issue, the issue category, the issue's RCI code, and more. You can export the file validation table as a CSV file. This file validation tool shows all the file issues that were identified after running a receiving job. For a more complete list of file issues, review your files in the global workspace in Data > Data Transfers described above.
Data version validation
Use the following tools to validate data versions in Visier.
Note: Users must have access to all data, such as the Super Admin permission . Full data access is crucial for efficient and accurate validation. To identify where the transformation has gone wrong, you must have visibility to all events passing through the system.
Tip: To learn more, take the Visier University eLearning course: Generating and troubleshooting data versions.
Data version download
To validate data records or troubleshoot data issues, download a data version table for available analytic objects, properties, and dimensions in your current data version as a TSV. For more information, see Data Version Download.
Business rules preview
Business rule preview is a tool used to check the output of a new or modified business rule without having to run a new data version, which greatly reduces time spent during business rule authoring. If there's an issue with one of your business rules, you can preview the business rule to check its output without generating a new data version. For more information, see Preview the business rule.
Debug inspector
The debug inspector allows you to inspect your data records and transformations made to your data throughout the event stream. If you identified an incorrect record in a metric but the value is correct in the source data you sent to Visier, you can use the debug inspector to find out how the record was transformed from your source data into Visier. For more information, see Debug Inspector.
Processing issues viewer
The processing issues viewer is a tool that shows all the event stream loader (ESL) issues generated from running a job. In the Processing Issues room, you can review the severity of each issue, at which stage of the event stream the issue occurred, the issue's RCI code, and more. You can export the processing issues table as a CSV file. For more information, see Processing Issues Viewer.
Tip: Use this tool after an initial data load, particularly for new topics or subjects as it can uncover silent issues that were not intended, such as replacement maps missing values, large numbers appearing in integer columns, or actions on non-existent events, and more.
Data Flow Visualization
Explore a visual representation of how data flows from your source files to Visier's analytic objects. Use this tool during the troubleshooting process to identify which mappings and rules are being applied to the data you’re debugging. This can help you locate where an issue might be occurring in the data transformation process. For more information, see Data Flow Visualization.
Troubleshooting techniques
In addition to the above tools, you can validate your data by comparing your source data against the data in Visier. This is the simplest method to validate your data in Visier; compare the values in Visier against your source files or source systems. As you're using Visier, you may run into values that seem wrong even though the data you loaded is correct. In the following sections, learn about how to troubleshoot different scenarios that you encounter in Visier.
The following table provides general troubleshooting methods to start with if you find incorrect values in Visier.
|
Where to check |
What to look for |
|---|---|
|
Metric |
Investigate all dependent objects in the metric.
|
|
Source files |
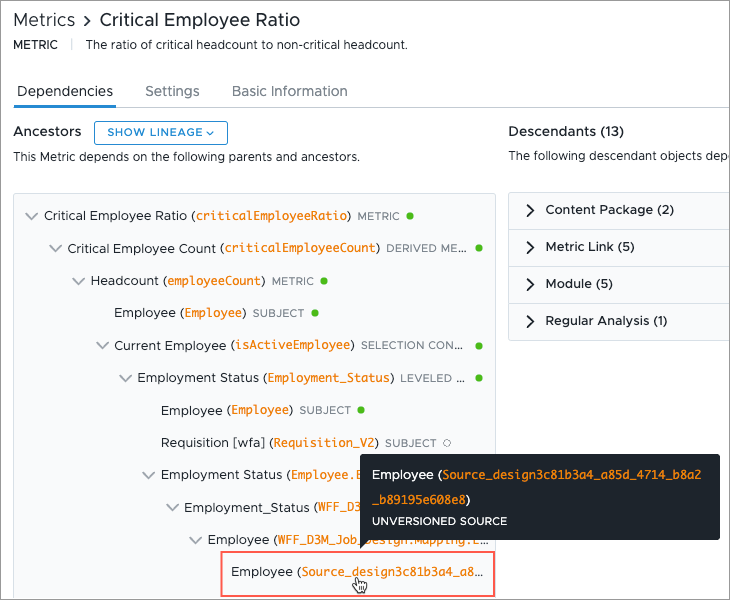
The problem may be in the source files provided to Visier. If you aren't sure which source to check, expand the metric's object dependencies to the lowest level to find the source. For more information about sources, see Sources.
|
|
Debug inspector |
Your data may be transformed by rules after mapping, causing the mapping preview to differ from the data in production. You can check data transformations in the debug inspector. It's common for the same issue to cause all records in a metric to display incorrectly. In the debug inspector:
For more information, see Debug Inspector. |
|
If all else fails |
Contact Visier Technical Support. |
Incorrect metric values
If you notice an incorrect metric value, try investigating the:
- Analysis context. If you're viewing a metric in the Explore room or in an analysis, there may be filters applied that alter the analysis context. Try removing the filters and groups bys, or checking Detailed View to find out what records are in the metric. We recommend changing the visual type to Trend and removing group bys. This approach helps you focus on the metric's values over time and identify where the data incorrectness originated. For more information about the Analysis Context toolbar, see Explore.
- Metric parameters. A metric's parameters can cause differences to the metric value you were expecting. For more information, see Change metric parameters.
- Trailing time. If the metric is using trailing time, the metric value may be different than you were expecting. For more information, see Change trailing time.
- Time period. If you notice missing data in a visualization, the time period may not contain any data. You can change the time period or change the Visual type to Trend to verify if the metric is missing data for a specific time. For more information, see Change the Time Context.
- Metric formula. If you notice an incorrect metric value, you can check the metric formula has the correct syntax, functions, and objects in the calculation. For more information, see Metric formulas.
- Metric dependencies. If you notice an incorrect metric value, you can investigate the objects that contribute to the metric to find out where the incorrect value is coming from. For more information, see Work With Metrics.
- Sources. If you notice an incorrect metric value, there may be an issue with the files in your source in Visier, such as blank or null values, incorrect column names, or incorrect date formatting. You can check your source files in the global workspace in Data > Sources > Select a source > Uploaded Files. For more information, see Sources.
- Mappings. If you notice an incorrect metric value, there may be an issue with a mapping, such as an incorrect override behavior, incorrect mapping data type, a property being mapped to the wrong column, or an extraction formula not covering all the intended cases. For more information, see Mappings.
Missing metrics, group bys, or filters
If you notice metrics, dimensions, or concepts that are missing from the Metric picker, Group By picker, or Filter picker, try investigating your:
- Permissions. If your user account in Visier doesn't have adequate data access to see the data represented by a metric, dimension, or concept, that object won't be visible to you in the solution experience. For more information, see Data and Content Security. If your permissions are correct, continue troubleshooting.
- Configurations in Studio.
- First, confirm that the object has Visible in Analytics turned on. To do that, in a project, navigate to the object and then open the Basic Information tab. If Visible in Analytics is turned off, the object won't be available to users in the solution experience.
- If a metric is missing, check the metric formula. For more information, see Work With Metrics. If the metric formula uses an object without available data, the formula is not valid and the metric isn't visible to users in the solution experience. If the metric formula contains syntax errors, the metric isn't visible to users in the solution experience.
- If there is no data available for a missing metric, you can access debug information in the Metrics list that can help you identify why there is no data. To do that, in a project, navigate to the metric and then click the See details button
 in the Data Available column.
 - If a concept is missing, check the concept configuration. For more information, see Concepts.
- If a dimension is missing, check the dimension configuration. For more information, see Dimensions.
- If you were expecting to group a metric by a specific attribute, you can check the subject associated with the metric and the attribute. The metric and the attribute must use the same subject to be used together in the solution experience. To find the subject associated with an object, do any of the following:
- For a metric, check the metric formula in the Formula tab.
- For a concept or dimension, check the Customize tab.
- Sources in Visier. You might be missing data for the object. For more information, see Sources. If you discover that you're missing data, you can send data to Visier. For more information, see Bring Data In.
- Mappings from source data to objects in Visier. To check your mappings, in a project, navigate to Data > Mappings. The subject associated with the missing object must have a mapping and the relevant subject properties must be mapped. For more information, see Mappings.
Unexpected value in Unknown category
Note: For more information about why unknown values show up in visualizations, see Show or Hide Data Items.
If you're using a group by and notice an unusually high or low value in the Unknown category, try the following validation options:
- Find all unknowns.
- In the Explore room, click the Visual picker and then select Breakdown. For more information, see Explore.
- Click the Settings button
 .
. - In the Chart settings panel, under Manage Items, turn on Show unknowns.
Result: You can now see all the unknown data items in the Breakdown visualization.
- Next, to find out which records are included in Unknown, select Unknownin the visualization.
In the Info panel
 , in the Insights tab, click View Details.
Result: You can now see the records that have an Unknown.
- Investigate the source file. If your source data contains nulls, Visier's default behavior is to treat nulls as unknown values. To check the source data, in the global workspace, navigate to Data > Sources and then select the source that contains data for the group by with unknown values.
- If data is missing, you can send corrected data files for the source that contain the missing data. For more information, see Bring Data In.
- If the source file is correct, there may be an issue with your mappings.
In a project, navigate to Data > Mappings and select the correct mapping.
In the list of properties, find the property.
Do one of the following:
If it's a Map to column mapping, check that the correct column is selected.
If it's a Map to formula mapping, check that the formula is referencing the correct column.
Preview the mapping to confirm that the records are correct. For more information, see Preview records in a mapping.
- If nulls are correct but you don't want nulls to show up as unknown values in Visier, adjust your mappings in Visier to assign nulls to a value other than Unknown. Do one of the following:
- In a project, navigate to Data > Mappings and select the correct mapping. In the list of properties, select Map from formula for the property that contains nulls. Write an extraction formula to assign nulls to a different value.
- If the group by is a dimension, in a project, navigate to Model > Dimensions and select the correct dimension. In the Configure tab, in the table, hover over the Unknown row. Click the Edit button
 and change the display name from "Unknown" to a different name.
 - If the group by is a leveled dimension or parent-child dimension, in a project, navigate to Model > Dimensions and select the correct dimension. In the Configure tab, under Values, click Edit. In the Map unknown value dialog, select a different value and then click Save.
Incorrect system starts or system terminations
If you encounter an incorrect number of system starts or terminations, there may be an issue in your data file. Before checking your files, you must understand system events in Visier. For more information, see Understanding System Events – How Visier Reconciles Employee Headcount.
Visier expects certain events in your starts and exits data. To validate your data, confirm that your files have the correct events. For more information, see Events to Include in the Employement Start and Employee Exit Files.
Unexpected attribute values
If you see an unexpected attribute value, such as a Job Name that should have updated from Developer I to Developer II but didn't, the most common cause is the data load. We recommend that most organizations send data to Visier every day and that the data is a monthly or weekly granularity. For more information about the frequency and granularity of data loads, see Frequency, Granularity, and Rolling Periods As They Relate to Your Data Extracts. You can also watch the video "Frequency, Granularity, and Rolling Periods" in Visier Organization Self-Serve Data Discovery.
An unexpected attribute value could also be caused by the override behavior in your mappings. Visier always takes the latest file, meaning that during the month, you may see daily changes to your data. At the end of the month, the last file of the month is taken and the previous daily files are ignored. You would not be able to see daily changes when looking back at the completed month. For more information about override behavior, see Add a Mapping.
If loading snapshot data, Visier groups dates together in the granularity that you send data in, such as weeks or months, and considers the events as occurring on the same day. Additionally, Visier always takes the latest file. This means that you won't necessarily see an event on the exact date that it happened. For example, let's say an employee's Direct Manager changed on January 16. Snapshot data records that event change as true on January 31 (the last file of January). Snapshot data is useful to correct data in the past, however, it is less accurate, and may cause you to see unexpected attribute values in Visier.
If loading data through connectors, you may find that your latest extraction job didn't include values that you expected. To resolve this, you can do a full extraction to retrieve all the missing information.
Unknown values in parent-child dimension
If you're analyzing a parent-child dimension, like Supervisory Hierarchy, and notice an Unknown category, your data may be missing one of the hierarchy nodes. In a parent-child dimension, the records must contain columns indicating what the record rolls up to in the hierarchy, such as an employee rolling up to a manager who rolls up to a director who rolls up to an executive. An unknown value indicates a missing record to roll up to.
To validate unknowns in a parent-child dimension, you can first identify a record that rolls up to the Unknown category. To do this, in a visualization, drill into the Unknown category and note the group bys. The group bys are the records that roll up to a missing hierarchy node. If you can't drill into Unknown, it means that the individuals directly report to Unknown. In this scenario, the next step is to go to the Detailed View visual to identify the people who report to Unknown and then cross-reference that information with your source data.
Then, in your source data, find the parent record that the record is supposed to roll up to. The parent record is likely missing from your data in Visier, causing the record to roll up to Unknown.
The parent record may be missing in Visier for one of the following reasons:
- The value in the source file is null.
- The record doesn't exist in the data file that determines the hierarchy, such as being spelled incorrectly or, if in the Supervisory Hierarchy, the person associated with the record is no longer at the organization.
Error message appears or chart doesn't display
If you encounter an error when your chart is loading or your chart doesn't display, try using the developer tools in your browser to investigate.
-
Right click on the page with the error, and select Inspect.
-
In the developer tools panel, click the Network tab.
-
In the list of names, find the tochart request.
-
Click the Response tab. If there is a server error, a RCI code and message will appear.
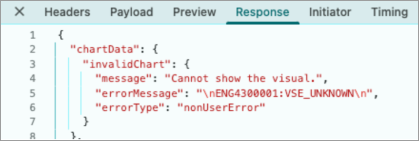
-
Send the RCI code and message to Visier Technical Support for further investigation.
Next steps
If you corrected the issues that you found during validation in a project, you can publish the project to production. For more information, see Publish Project Changes.
In this section